We will show a simple case to see how we can monitor, publish and log data provided by an ESP32 board in our circusofthings.com dashboard.
We will measure and publish an indoor temperature just like we did in a previous tutorial (Publish your Arduino Data to the cloud) with an Arduino nano Board and ESP8266/ESP01 module.
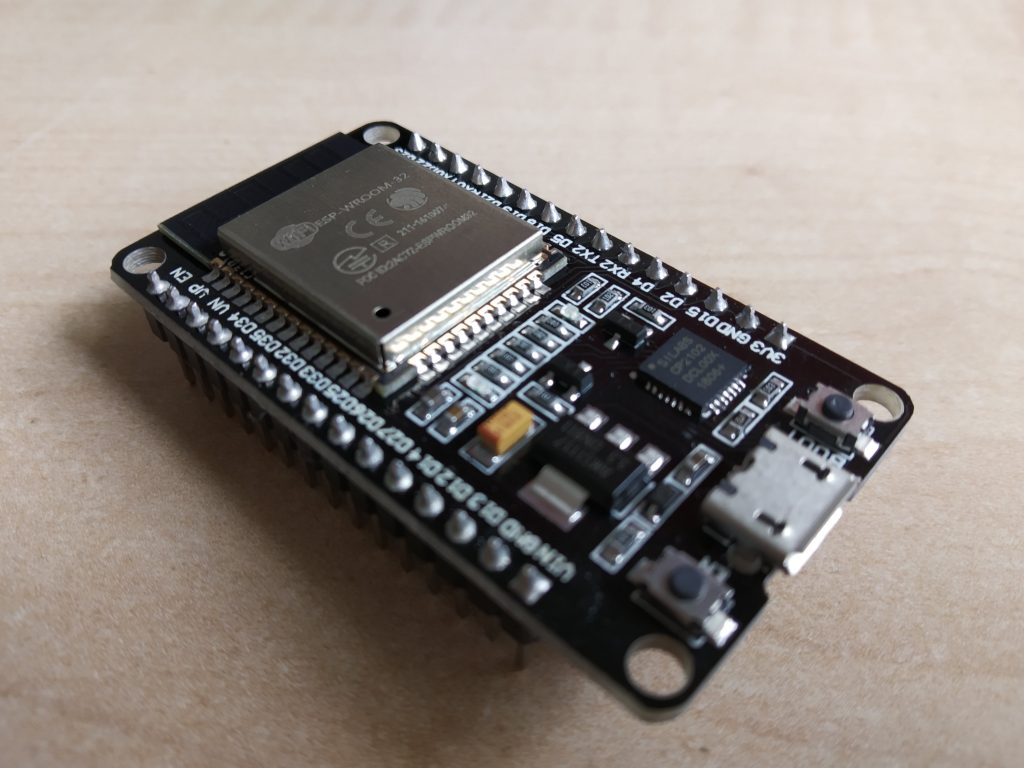
For our current experiment, the exact model of ESP32 is DEVKITV1 from Expressif. But any ESP32 board from any manufacturer should work the same way. Just take care of the pinout for your model and set the proper pin for sensor in the code.
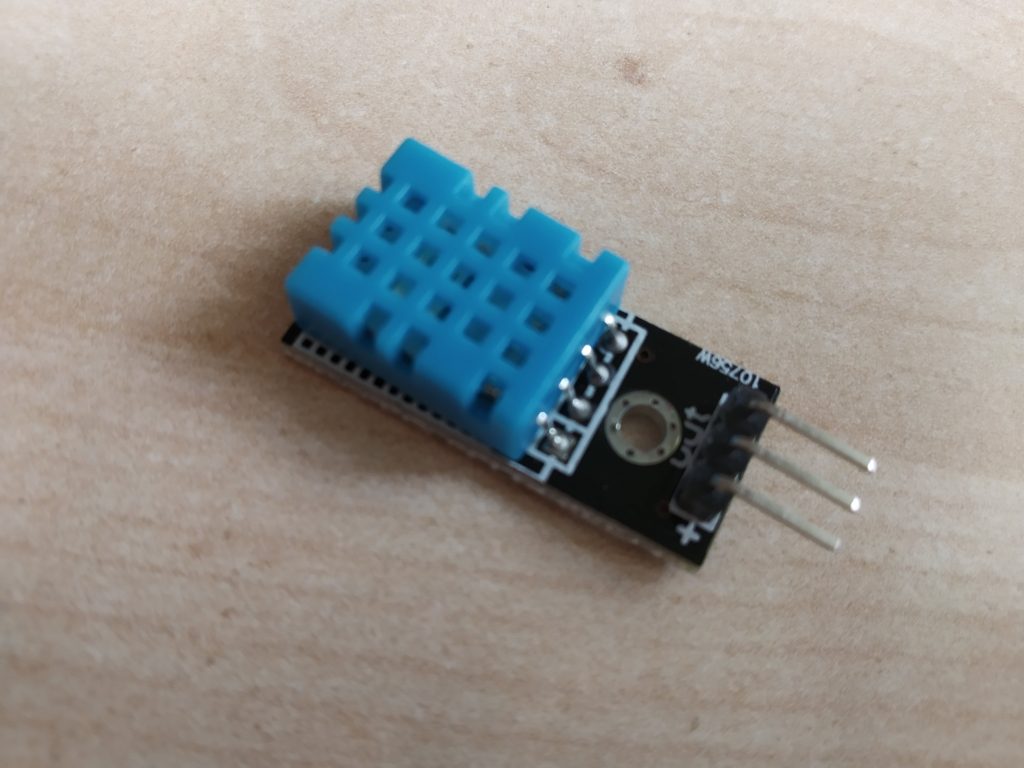
Again, the sensor for the temperature will be a cheap DHT11. A well known device very easy to use with its Arduino library. Remember DHT11 is not working as an analog input or several digital inputs, rather than this the input will be a serial stream communication in one pin with a manufacturer’s protocol (which you don’t have to care about as the library will do all for you).
In this tutorial, we will be programming the board with C++ in Arduino IDE. There are a few ways more to do it as ESP-IDF, NodeMCU, among others. Just tell me if you are interested to see an approach to it in next posts.
Setting what you need in Arduino IDE
ESP32 is not an Arduino business, it’s an Expressif one (yes, maybe many of you know it, but let me tell you for that people who ever needed to ear it like me). So the “normal” environment to program it is ESP-IDF API and is the best as you can take profit of straight multitasking and the full set of hardware features.
In this tutorial we will do it in the Arduino way using its IDE and therefore its coding language and routines. So our goal now is adding all those things that the Arduino IDE needs for the special case of ESP32, because as you can check you can’t find ESP32 device in Tools > Board > … menu.
If you are on Ubuntu I strongly recommend this tutorial for Ubuntu. I followed the same.
Otherwise, for Windows, you have the analogous tutorial
After all you will have available in your menu the ESP32 option:
Now that we have our Arduino IDE set we can keep moving on
Making a dashboard to monitor and data-log
As usual, we will rely on our platform “Circus of Things” so we don’t have to take care about the server side, while having a dashboard to monitor and data-log, and a community to share our connections (if we want and set them to public).
As for Arduino, Raspberry and the rest of electronics, we will set a library in our ESP32 so it can Read and/or Write values from the Circus, through its Circus REST API. Then our values will be ready regardless of the type of board we have.
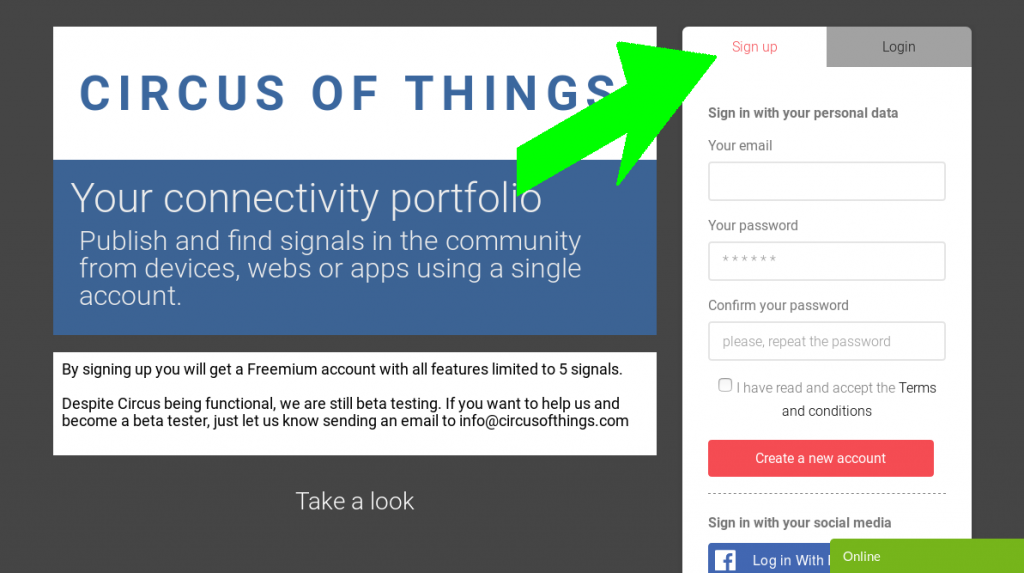
First of all, if you don’t have one yet, you need to create a free account that will have all the features enabled . We can make it by following the simple steps for sign up in the landing page:
Then will go to Workshop where our own signals are created:
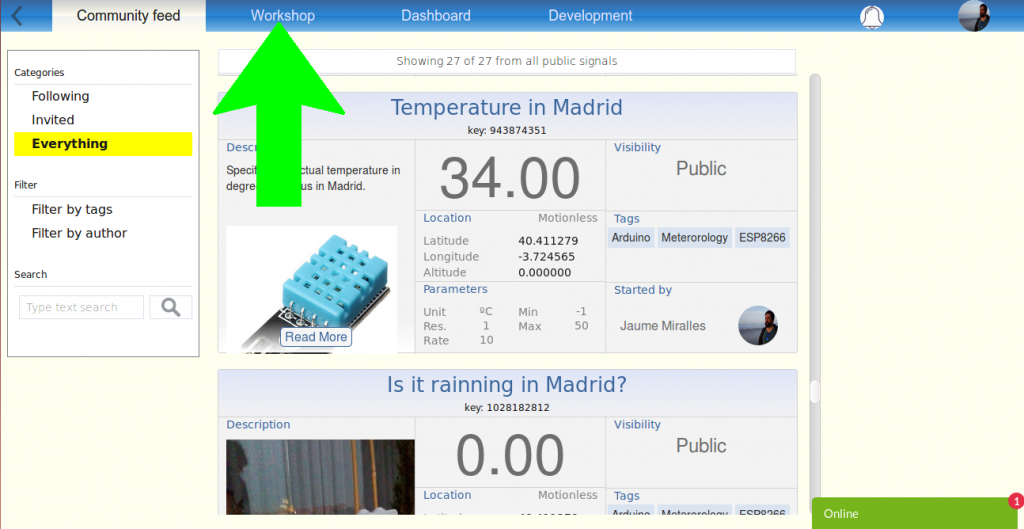
Create a signal and remind its Key to identify it when the code is set.
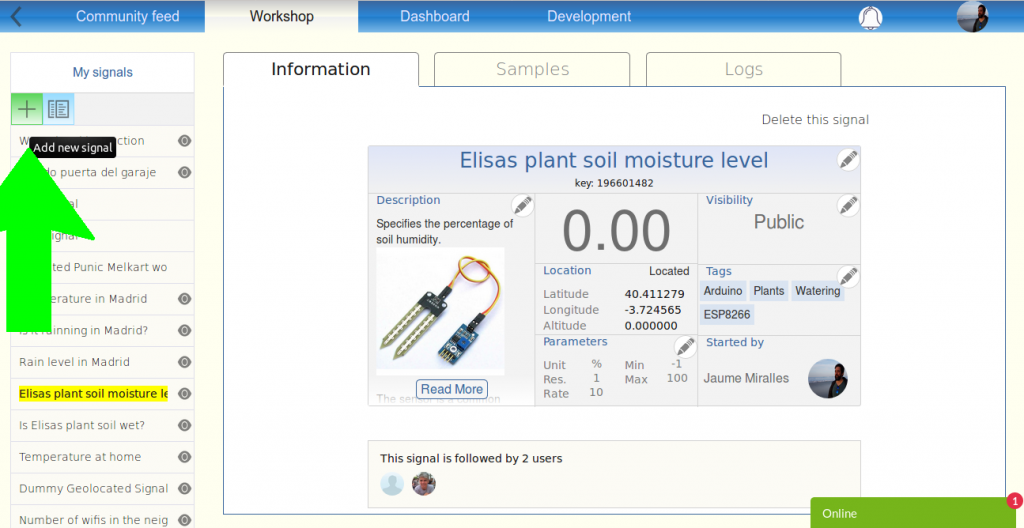
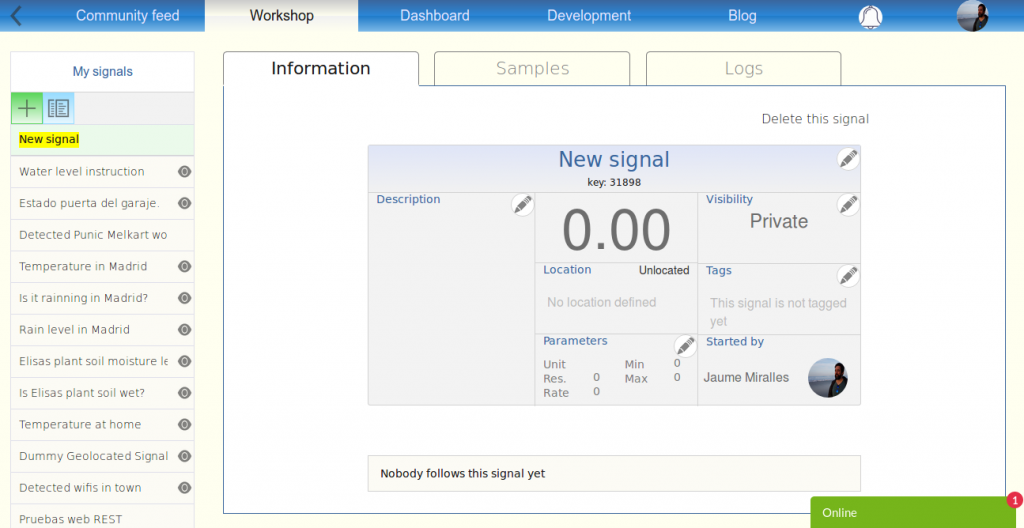
Feel free to edit the information with the title, description, tags that you consider to be right.
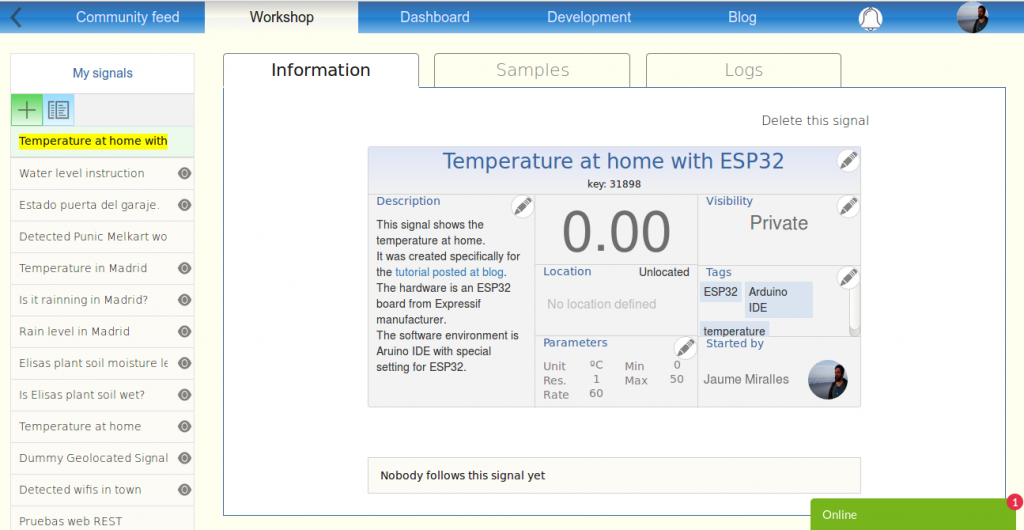
Now you have a signal well defined representing the Temperature, waiting for the ESP32 to feed its value over time. Note that the value is not changing.
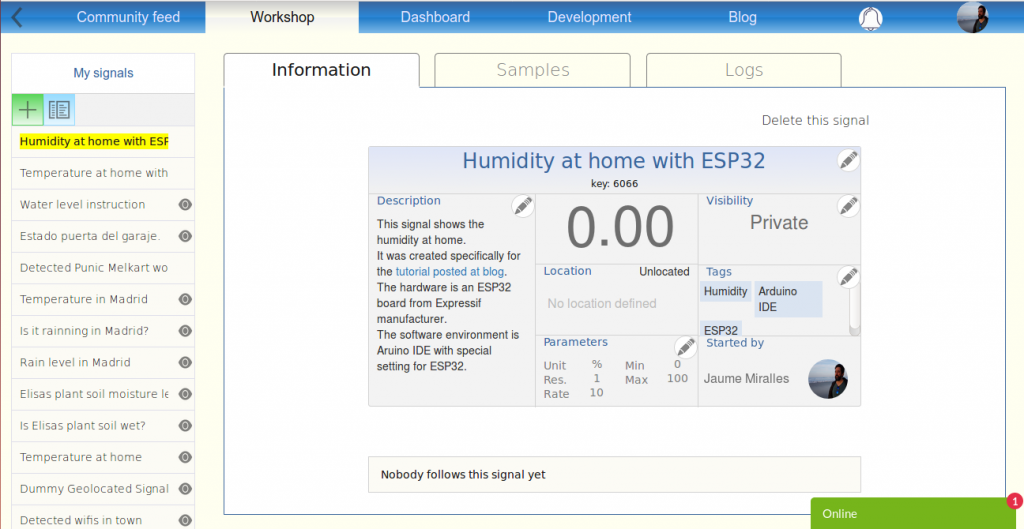
Do the same process for the Humidity:
Connecting the electronics
Not much to say, really.
Connect the USB to your PC, it’s more than enough to power your ESP32 (in this experiment, it might not in other cases). Plus, you will be able to see debug messages in the console (115200baud if not changed).
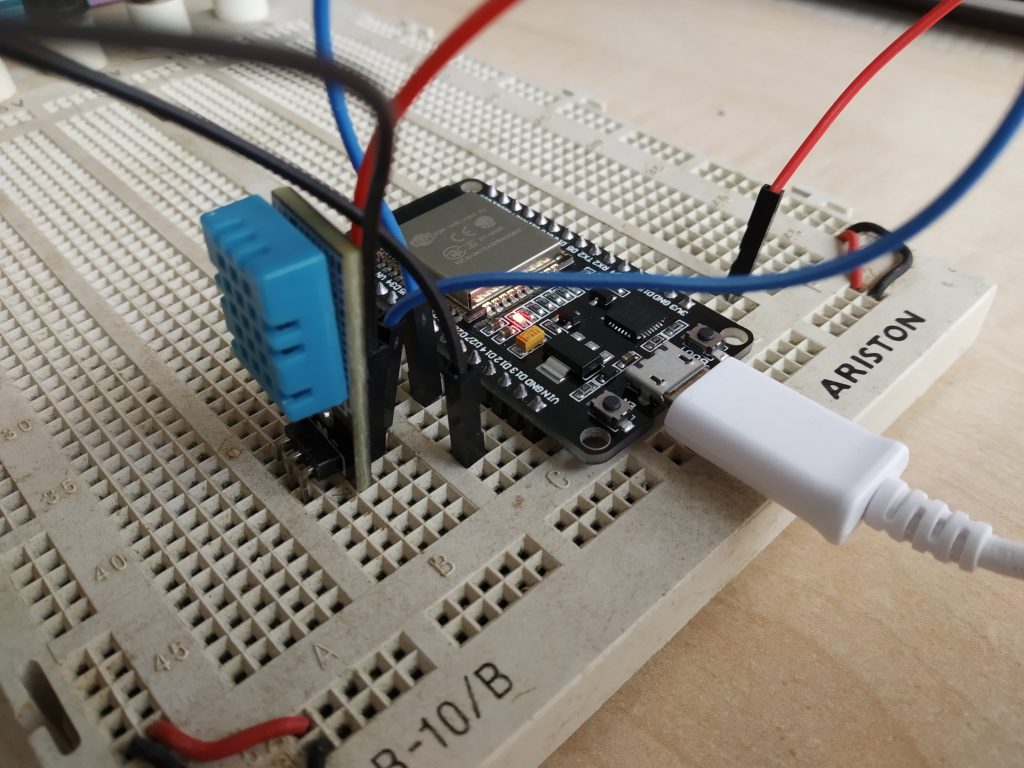
DHT11 will accept the 3,3V power supply output of the ESP32 and its GND.
I choose pin D27 for the output of the DHT11. Could be any other else while it is digital and you bear in mind when declaring its variable in the Arduino sketch.
Should look like this:
Programming the ESP32
You will have a very simple “.ino” sketch and let our library do all the dirty work.
The library is intended to handle the communication and REST API implementation on a ESP32 board so that you only have to worry to call two functions:
- Write: Will set a ‘value’ to the signal at Circus, defined by the ‘Key’. The ‘token’ will let our platform know who you are and give you access.
- Read: Will return the ‘value’ read from the signal defined by ‘key’. Again the token will give you access.
You can download the library here.
This is the sketch we will use to give life to our ESP32 board, you can copy-paste or find it in examples folder of your download (it is called WriteFromESP32TempHum.ino)
#include <CircusESP32Lib.h>
#include <DHT.h>


// ------------------------------------------------
// These are the CircusESP32Lib related declarations
// ------------------------------------------------

char ssid[] = "your_SSID_here"; // Place your wifi SSID here
char password[] =  "your_password_here"; // Place your wifi password here
char token[] = "your_token_here"; // Place your token, find it in 'account' at Circus. It will identify you.
char server[] = "www.circusofthings.com";
char temperature_key[] = "31898";  // Place the Key of the signal you created at Circus Of Things for the Temperature
char humidity_key[] = "6066";  // Place the Key of the signal you created at Circus Of Things for the Humidity
CircusESP32Lib circusESP32(server,ssid,password); // The object representing an ESP32 to whom you can order to Write or Read

// ------------------------------------------------
// These are the Temperature Example related declarations
// ------------------------------------------------

#define DHTPIN 27      // digital of your ESP32 connected to DHT11
#define DHTTYPE DHT11 // exact model of temperature sensor DHT 11 for the general library
DHT dht(DHTPIN, DHTTYPE); // The object representing your DHT11 sensor


void setup() {
    Serial.begin(115200); // Remember to match this value with the baud rate in your console
    dht.begin(); // Set the DHT11 ready
    circusESP32.begin(); // Let the Circus object set up itself for an SSL/Secure connection
}

void loop() { // Now that all is set up, let's begin with the tasks

    delay(10000);
    // Let the library get the Temperature that DHT11 probe is measuring.
    float t = dht.readTemperature();
    if (isnan(t))
        t=-1; // if so, check the connection of your DHT11 sensor... something is disconnected ;-)
    float h = dht.readHumidity();
    if (isnan(h))
        h=-1; // if so, check the connection of your DHT11 sensor... something is disconnected ;-)
    // Show values, just for debuging
    Serial.println(""); Serial.print("Temperature: "); Serial.println(t); Serial.print("Humidity: "); Serial.println(h);

    // Report the values gathered by the sensor to the Circus
    circusESP32.write(temperature_key,t,token); // Report the temperature measured to Circus.
    circusESP32.write(humidity_key,h,token); // Report the humidity measured to Circus.
}
Simple, isn’t it? Will try to connect to Wifi and reach Circus platform via https. Later, in the loop, will measure the Temperature and Humidity and report (with ‘Write’ command) to Circus.
Don’t forget to:
- Set your wifi SSID
- Set your wifi password
- Set the proper keys that you created at Circus
- Set your personal token (find it at Circus in ‘account’ section, on the top-right corner clicking your image)
- If you have another model of ESP32 or simply want to use another pin, check in the code the correct pin where you connected the DH11 output.
The result
Now watch the values dynamically change in the Workshop
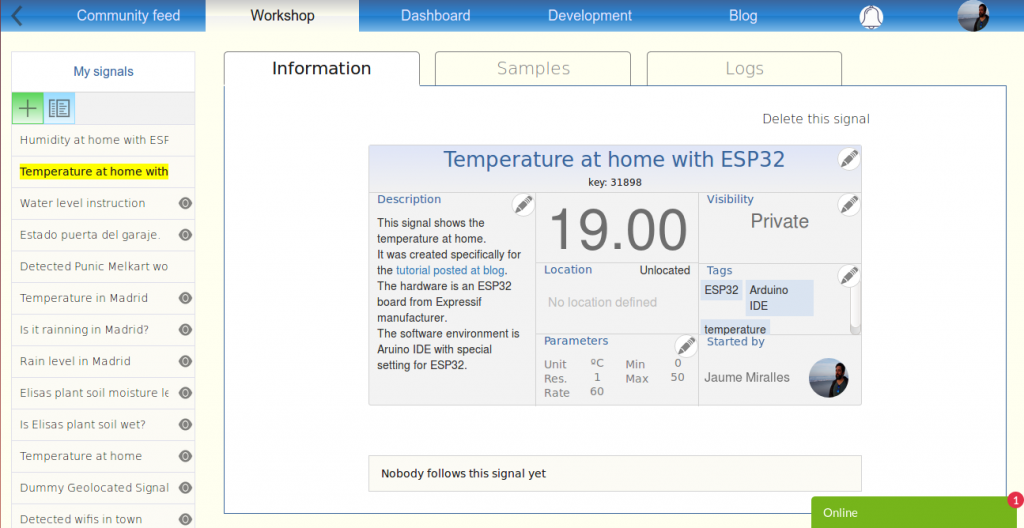
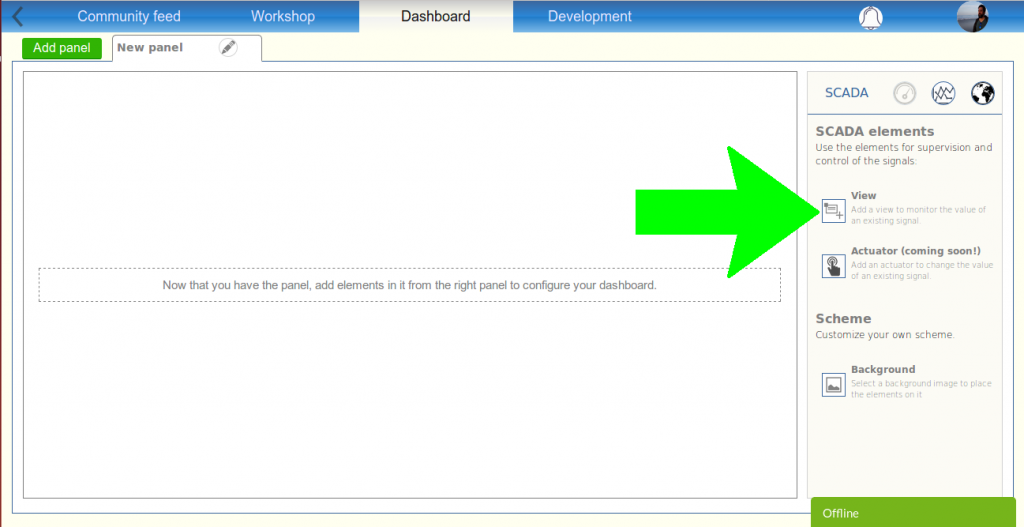
It’s time to set the dashboard to monitor your signals. Go to dashboard:
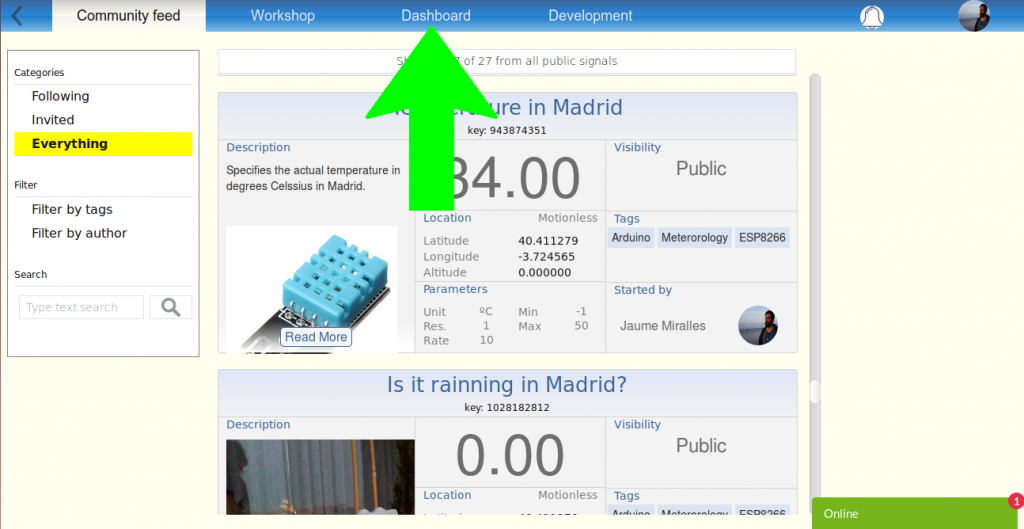
Add a new panel, and set a name for it, let’s say “ESP32 tutorial signals”
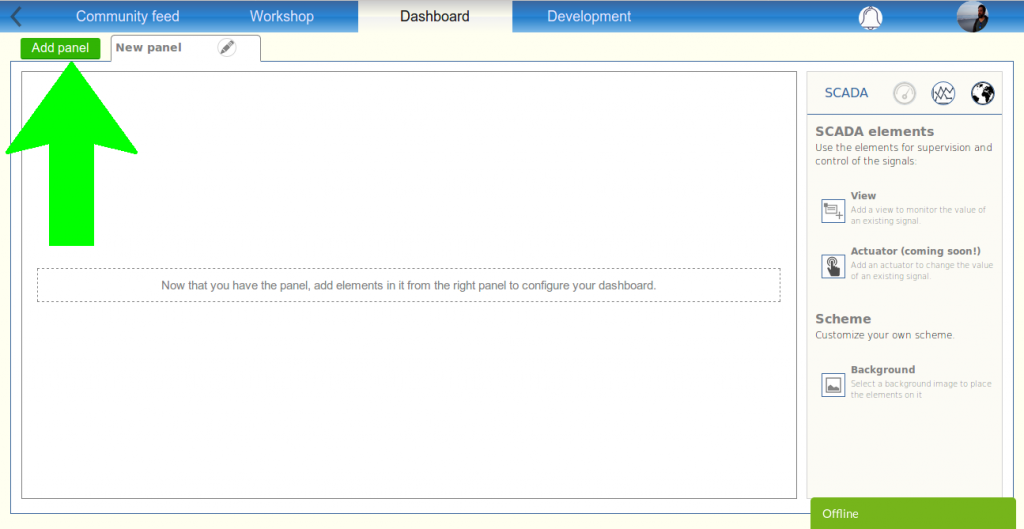
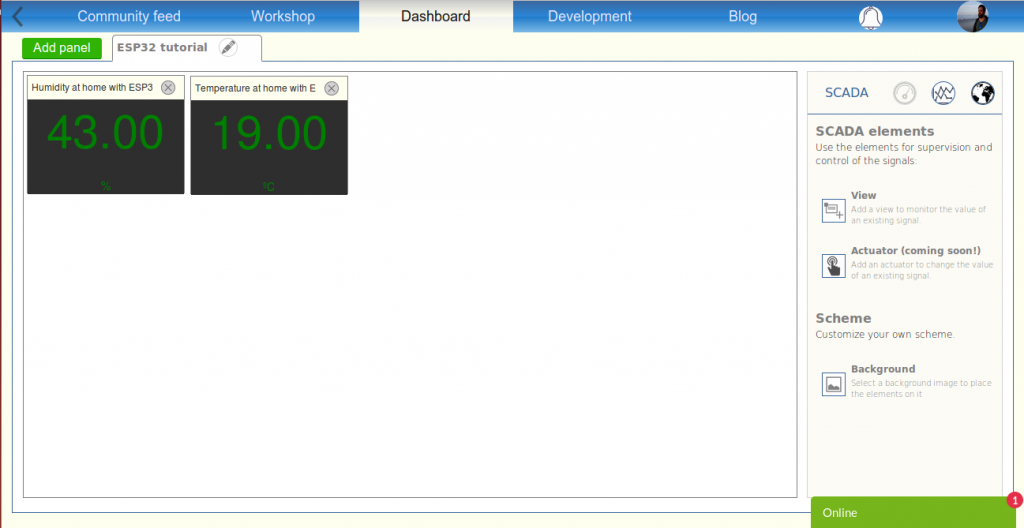
Add a view for each signal that your ESP32 is feeding right now. Select them in the list after pressing “View”. Drag & drop it to place where you want in the screen
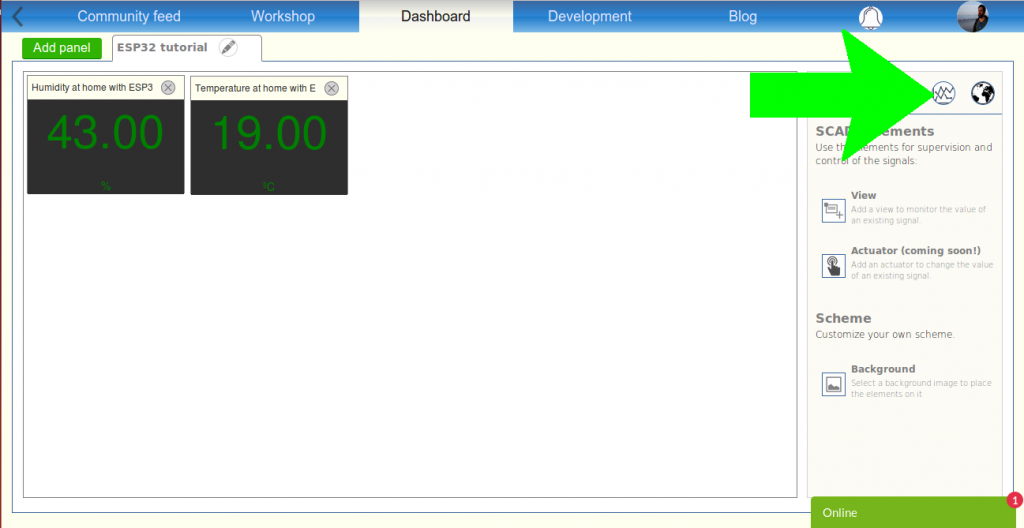
Switching the panel from “SCADA mode” to “Timeline mode”
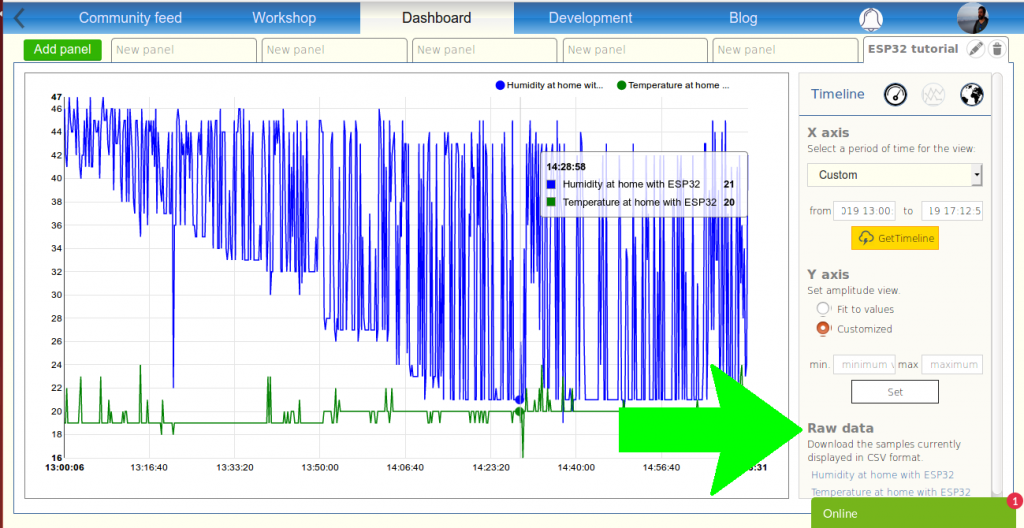
… you will have both signals represented in graphical mode and in real-time
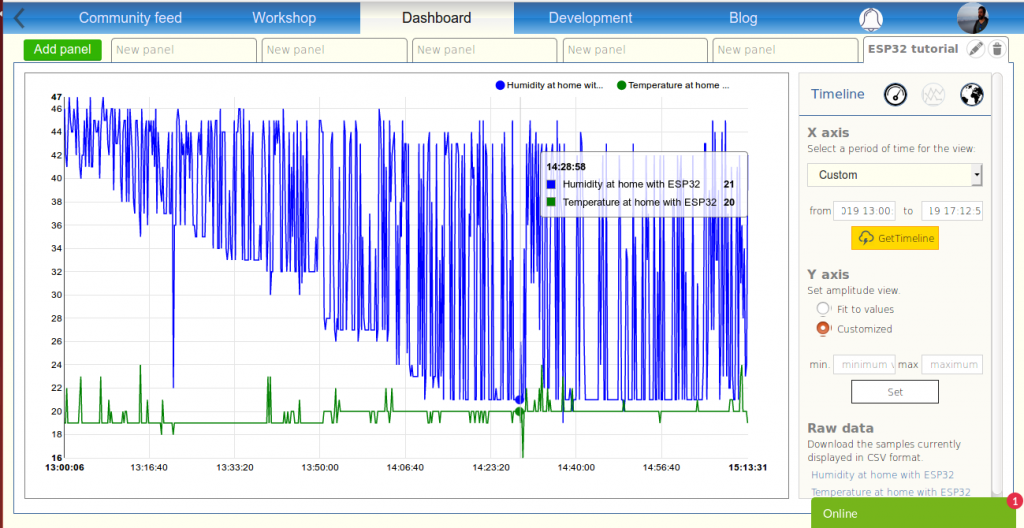
By pressing the links you can download the data in CSV format for each signal
There are many features more to explore!
Thanks for your time and reading this post. Please feel free to contact in chat or comments, your feedback is much appreciated.