Monitoring temperature and humidity with ESP32 (programmed with Arduino IDE)

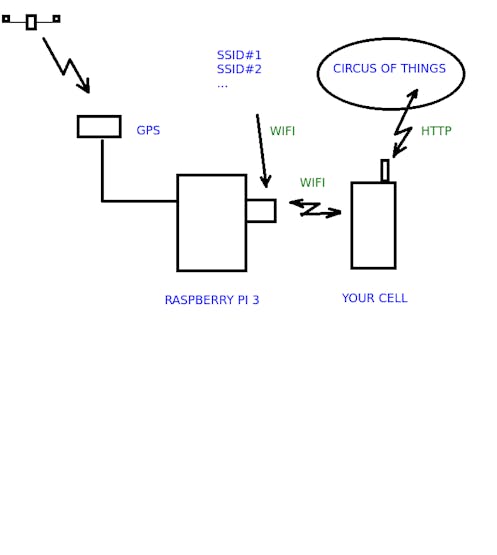
We will show a simple case to see how we can monitor, publish and log data provided by an ESP32 board in our circusofthings.com dashboard.

We will measure and publish an indoor temperature just like we did in a previous tutorial (Publish your Arduino Data to the cloud) with an Arduino nano Board and ESP8266/ESP01 module.

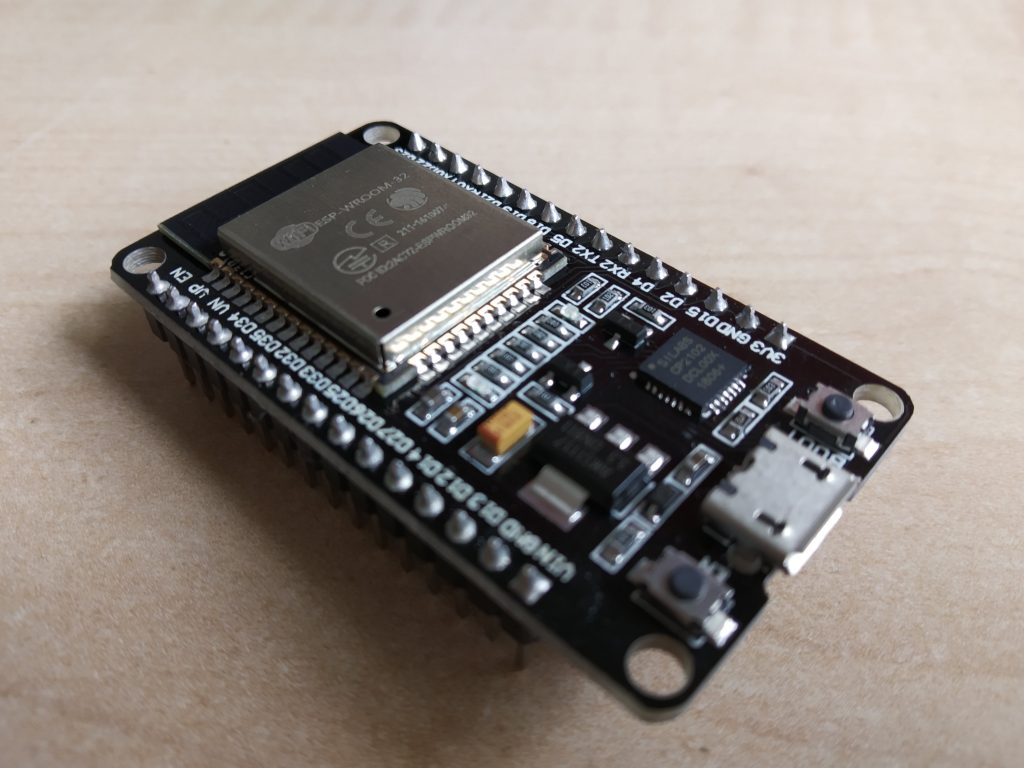
For our current experiment, the exact model of ESP32 is DEVKITV1 from Expressif. But any ESP32 board from any manufacturer should work the same way. Just take care of the pinout for your model and set the proper pin for sensor in the code.

ESP32 is DEVKITV1

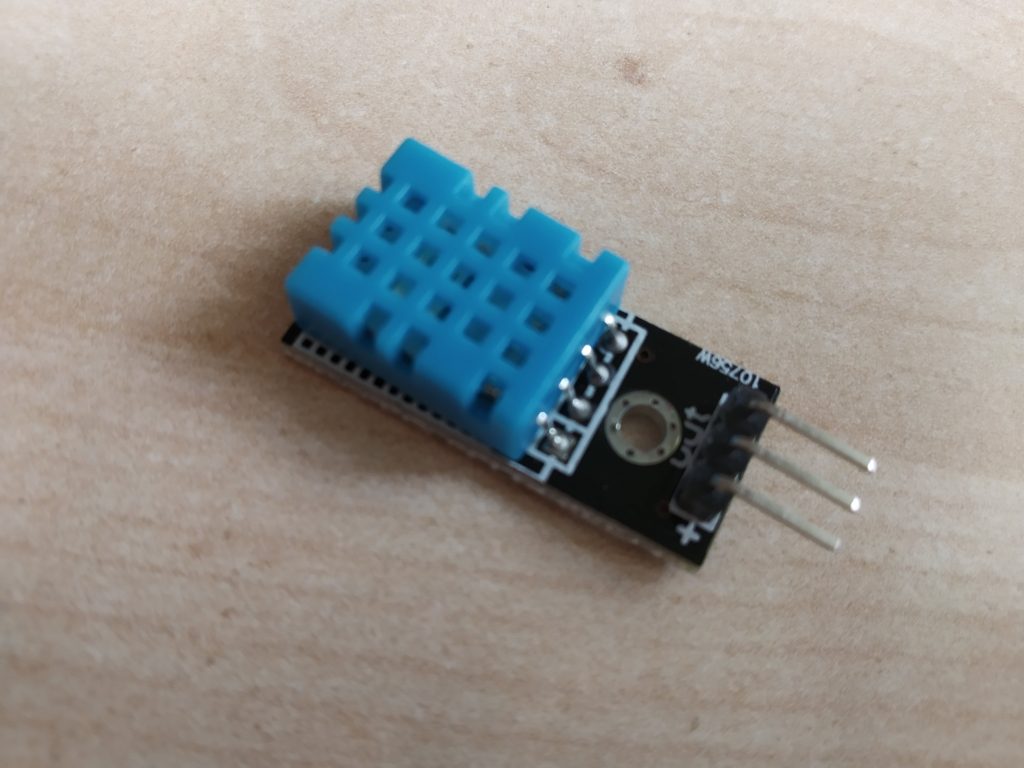
Again, the sensor for the temperature will be a cheap DHT11. A well known device very easy to use with its Arduino library. Remember DHT11 is not working as an analog input or several digital inputs, rather than this the input will be a serial stream communication in one pin with a manufacturer’s protocol (which you don’t have to care about as the library will do all for you).

DHT11

In this tutorial, we will be programming the board with C++ in Arduino IDE. There are a few ways more to do it as ESP-IDF, NodeMCU, among others. Just tell me if you are interested to see an approach to it in next posts.

Setting what you need in Arduino IDE

ESP32 is not an Arduino business, it’s an Expressif one (yes, maybe many of you know it, but let me tell you for that people who ever needed to ear it like me). So the “normal” environment to program it is ESP-IDF API and is the best as you can take profit of straight multitasking and the full set of hardware features.

In this tutorial we will do it in the Arduino way using its IDE and therefore its coding language and routines. So our goal now is adding all those things that the Arduino IDE needs for the special case of ESP32, because as you can check you can’t find ESP32 device in Tools > Board > … menu.

If you are on Ubuntu I strongly recommend this tutorial for Ubuntu. I followed the same.

Otherwise, for Windows, you have the analogous tutorial

After all you will have available in your menu the ESP32 option:

Now that we have our Arduino IDE set we can keep moving on

Making a dashboard to monitor and data-log

As usual, we will rely on our platform “Circus of Things” so we don’t have to take care about the server side, while having a dashboard to monitor and data-log, and a community to share our connections (if we want and set them to public).

As for Arduino, Raspberry and the rest of electronics, we will set a library in our ESP32 so it can Read and/or Write values from the Circus, through its Circus REST API. Then our values will be ready regardless of the type of board we have.

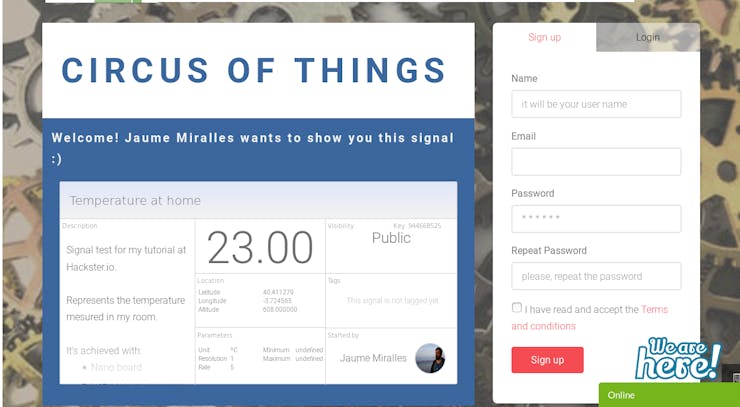
First of all, if you don’t have one yet, you need to create a free account that will have all the features enabled . We can make it by following the simple steps for sign up in the landing page:

Sign up on Circus

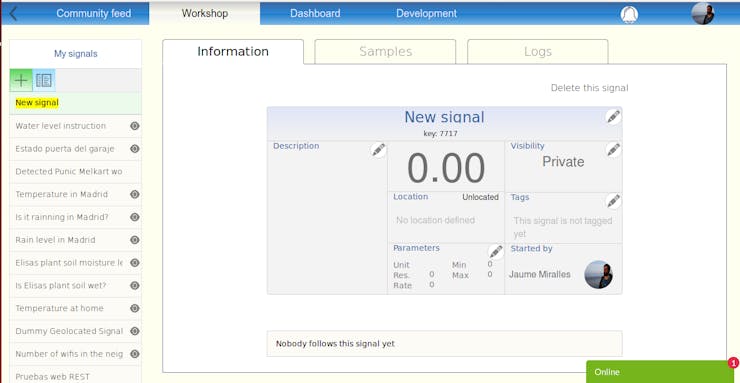
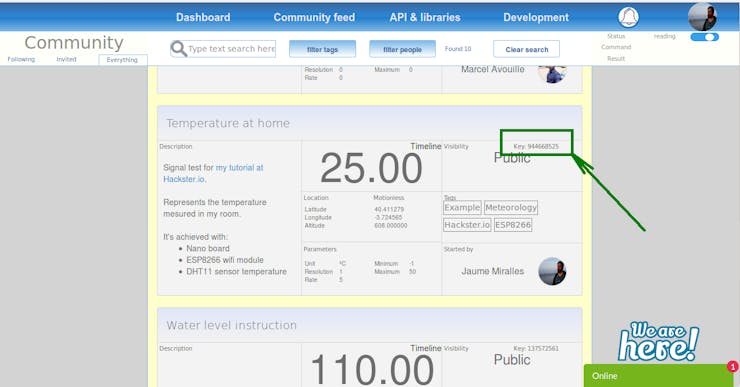
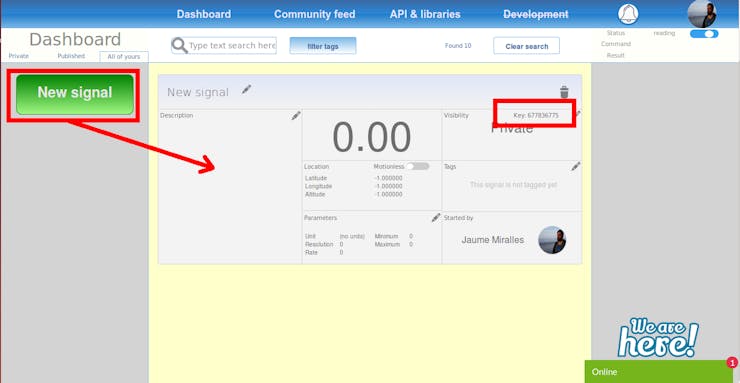
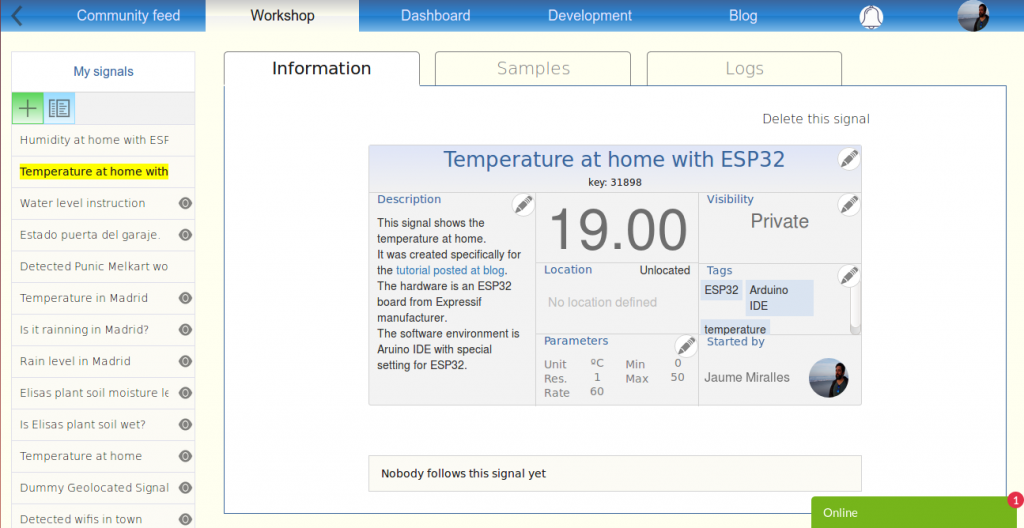
Then will go to Workshop where our own signals are created:

Enter at workshop

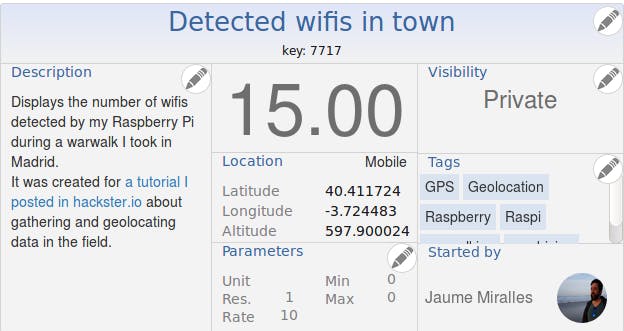
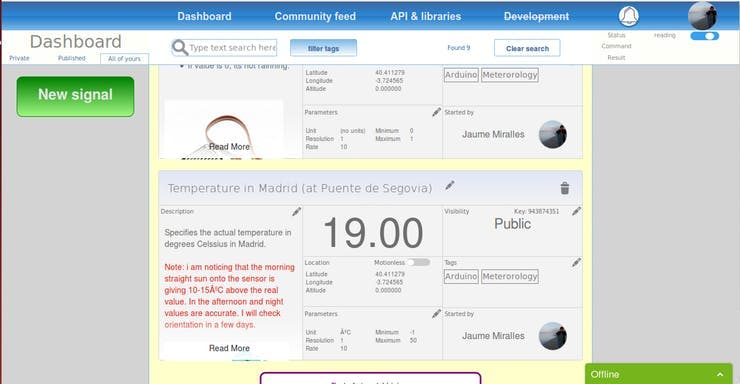
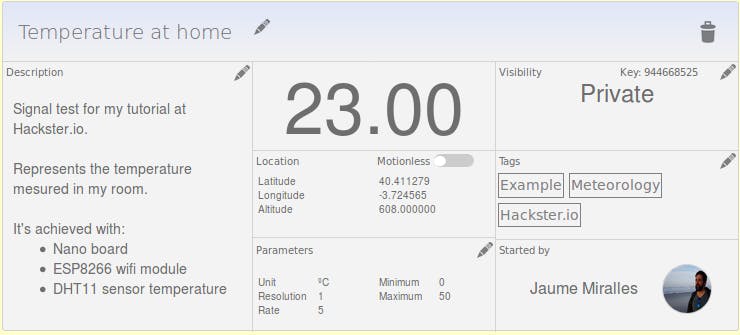
Create a signal and remind its Key to identify it when the code is set.

Add signal
New signal created

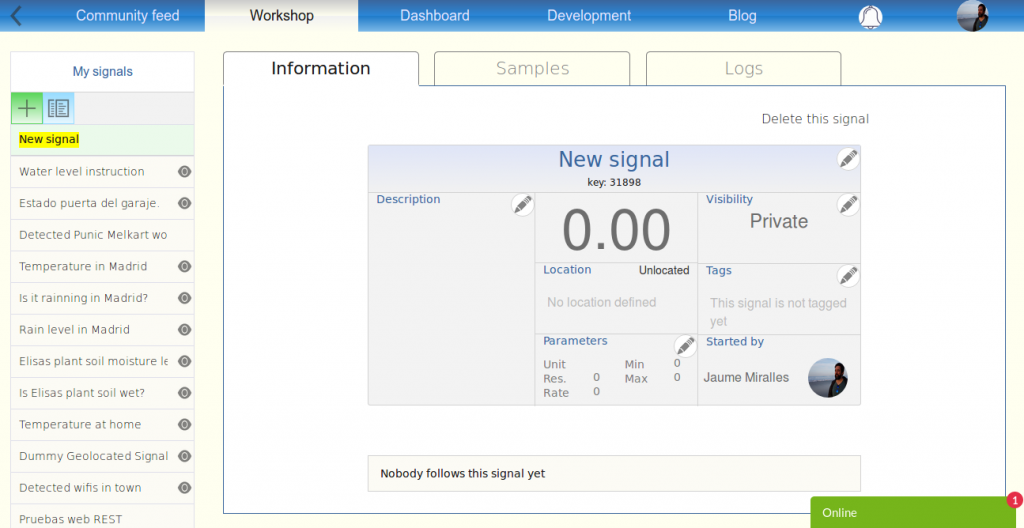
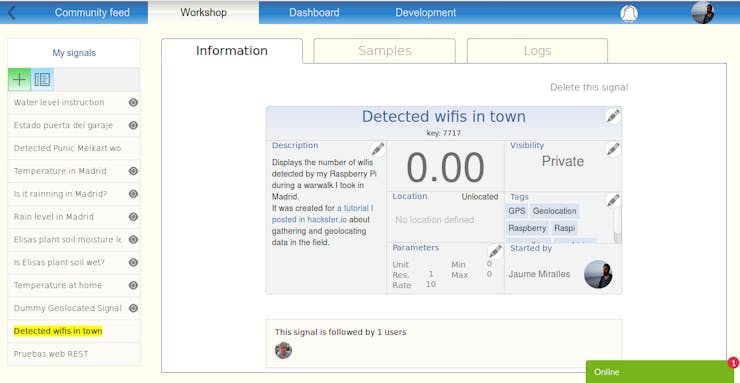
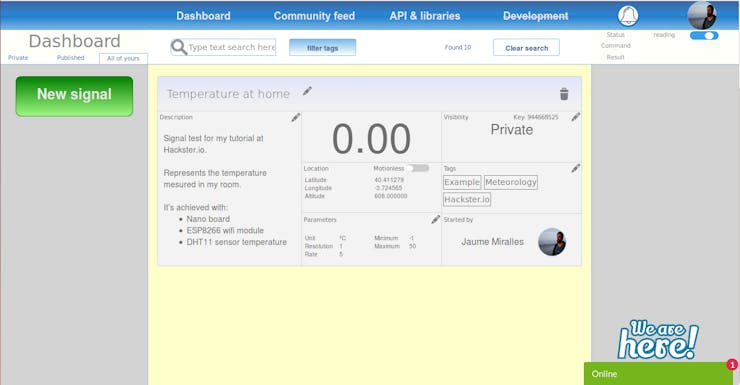
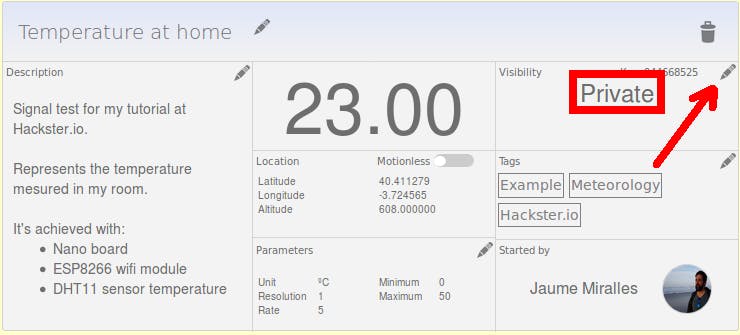
Feel free to edit the information with the title, description, tags that you consider to be right.

Now you have a signal well defined representing the Temperature, waiting for the ESP32 to feed its value over time. Note that the value is not changing.

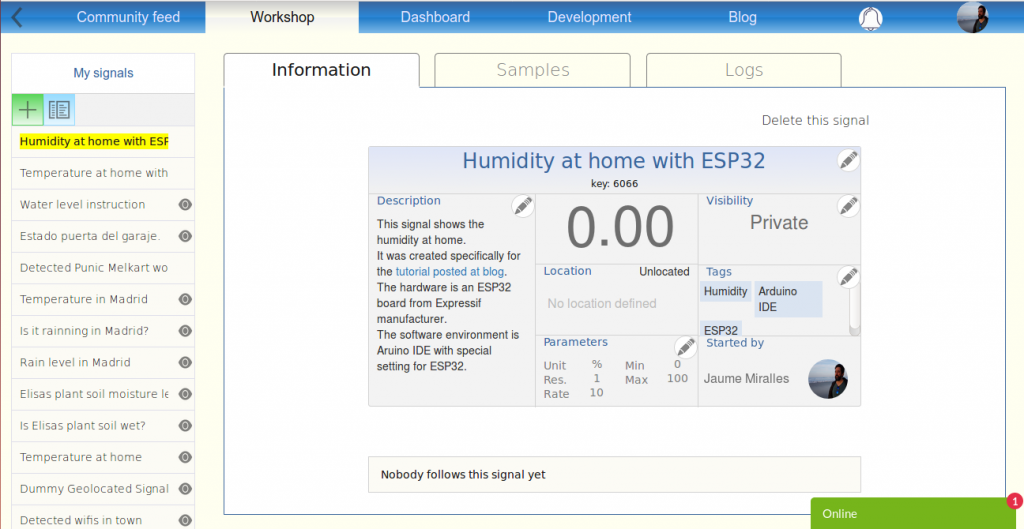
Do the same process for the Humidity:

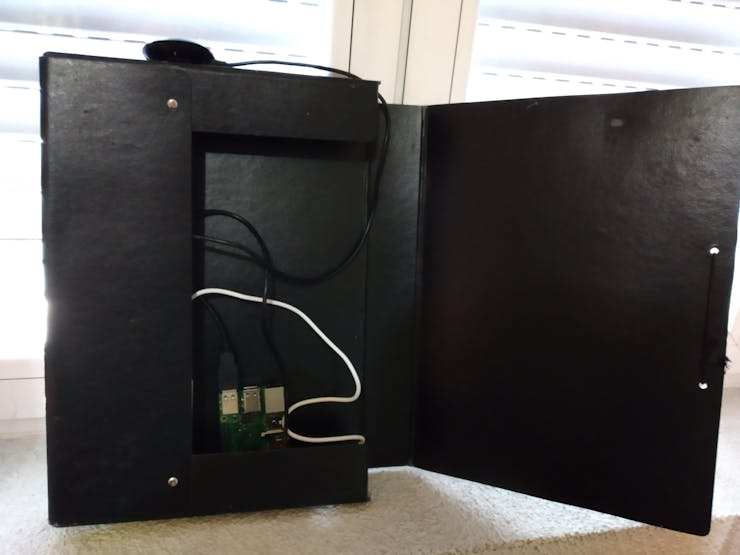
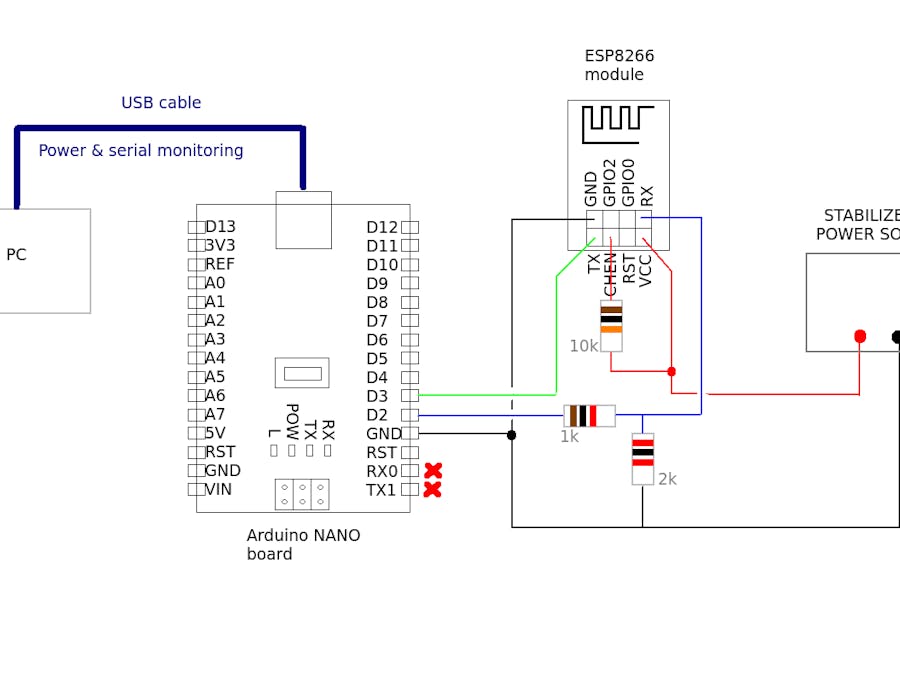
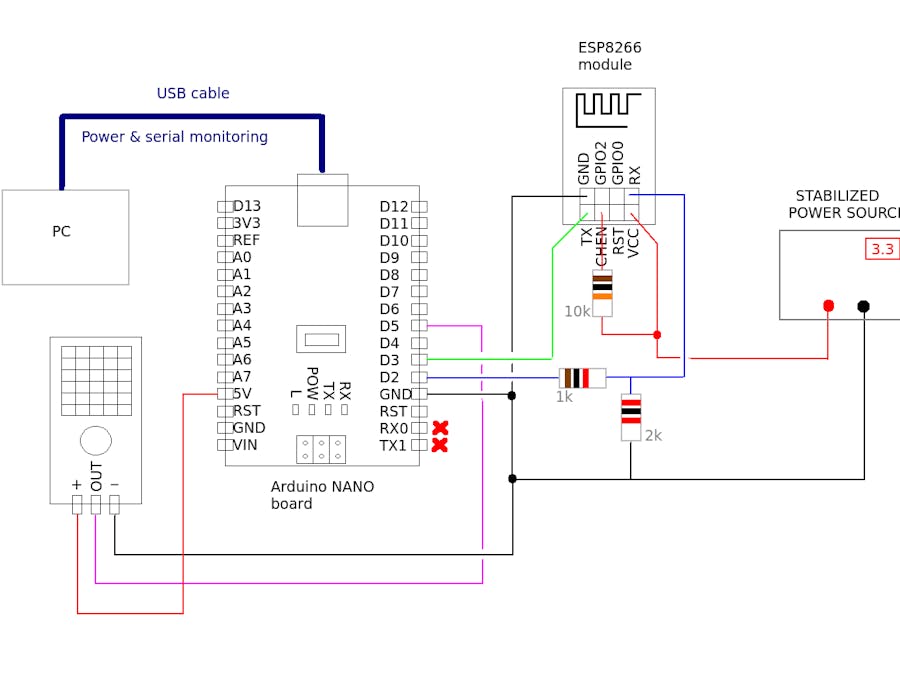
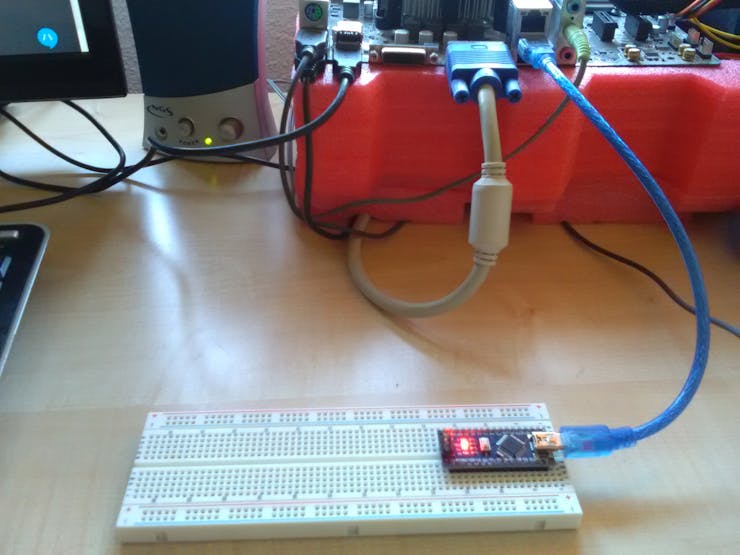
Connecting the electronics

Not much to say, really.

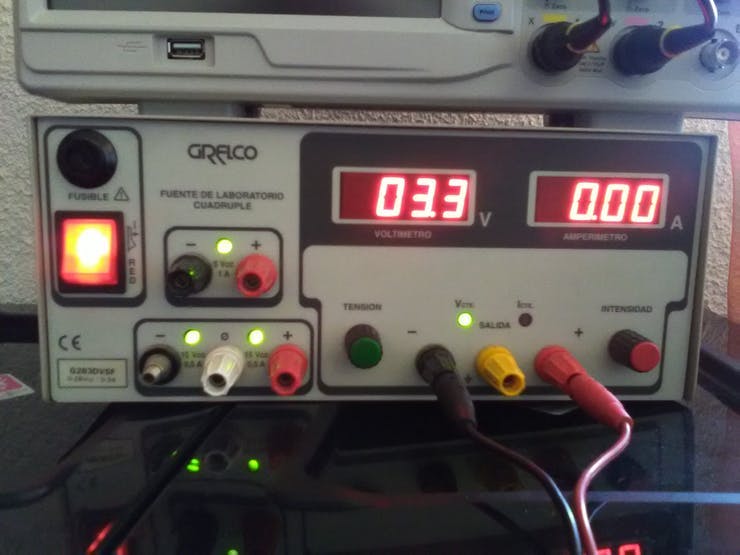
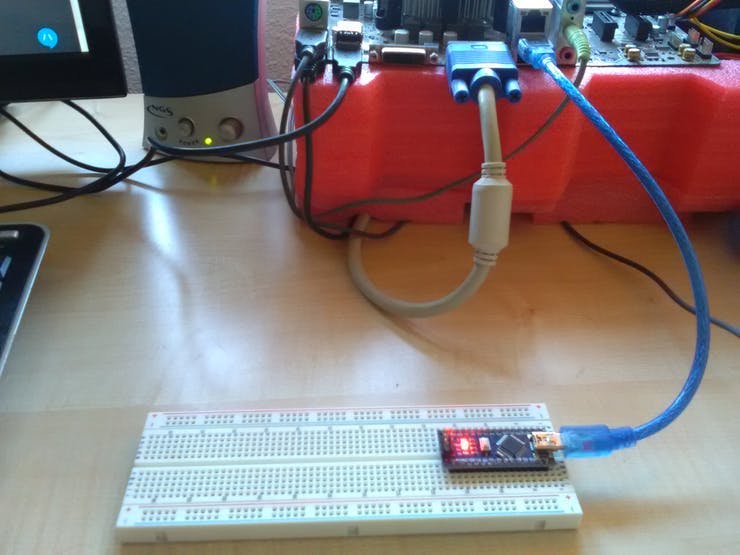
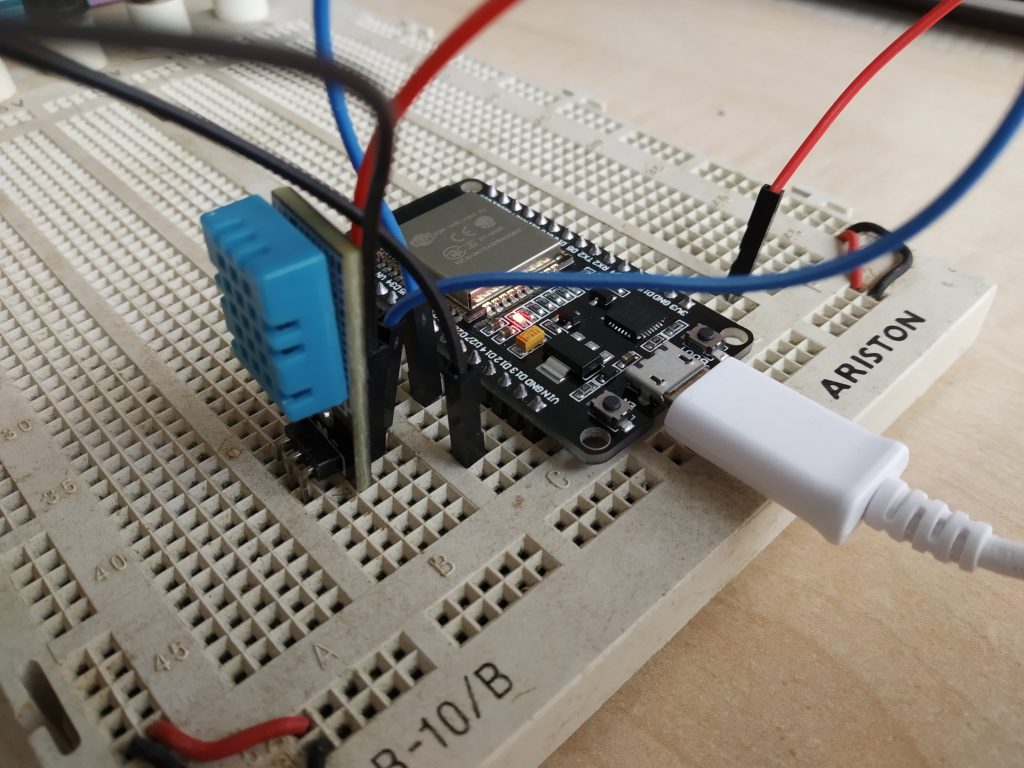
Connect the USB to your PC, it’s more than enough to power your ESP32 (in this experiment, it might not in other cases). Plus, you will be able to see debug messages in the console (115200baud if not changed).

DHT11 will accept the 3,3V power supply output of the ESP32 and its GND.

I choose pin D27 for the output of the DHT11. Could be any other else while it is digital and you bear in mind when declaring its variable in the Arduino sketch.

Should look like this:

Programming the ESP32

You will have a very simple “.ino” sketch and let our library do all the dirty work.

The library is intended to handle the communication and REST API implementation on a ESP32 board so that you only have to worry to call two functions:

  • Write: Will set a ‘value’ to the signal at Circus, defined by the ‘Key’. The ‘token’ will let our platform know who you are and give you access.
  • Read: Will return the ‘value’ read from the signal defined by ‘key’. Again the token will give you access.

You can download the library here.

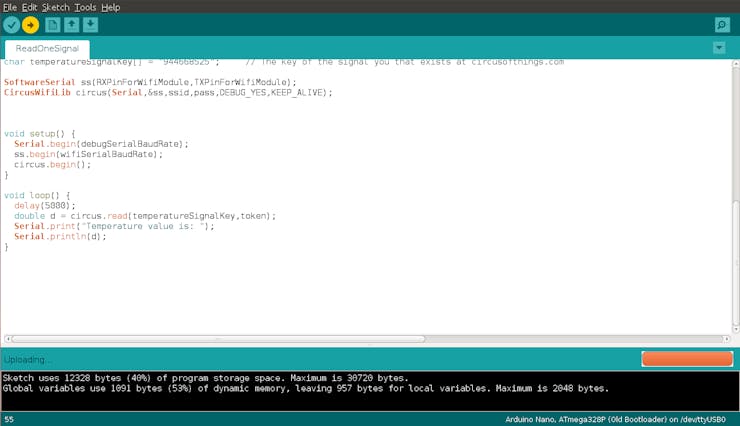
This is the sketch we will use to give life to our ESP32 board, you can copy-paste or find it in examples folder of your download (it is called WriteFromESP32TempHum.ino)

#include <CircusESP32Lib.h>
#include <DHT.h>


// ------------------------------------------------
// These are the CircusESP32Lib related declarations
// ------------------------------------------------

char ssid[] = "your_SSID_here"; // Place your wifi SSID here
char password[] =  "your_password_here"; // Place your wifi password here
char token[] = "your_token_here"; // Place your token, find it in 'account' at Circus. It will identify you.
char server[] = "www.circusofthings.com";
char temperature_key[] = "31898";  // Place the Key of the signal you created at Circus Of Things for the Temperature
char humidity_key[] = "6066";  // Place the Key of the signal you created at Circus Of Things for the Humidity
CircusESP32Lib circusESP32(server,ssid,password); // The object representing an ESP32 to whom you can order to Write or Read

// ------------------------------------------------
// These are the Temperature Example related declarations
// ------------------------------------------------

#define DHTPIN 27      // digital of your ESP32 connected to DHT11
#define DHTTYPE DHT11 // exact model of temperature sensor DHT 11 for the general library
DHT dht(DHTPIN, DHTTYPE); // The object representing your DHT11 sensor


void setup() {
    Serial.begin(115200); // Remember to match this value with the baud rate in your console
    dht.begin(); // Set the DHT11 ready
    circusESP32.begin(); // Let the Circus object set up itself for an SSL/Secure connection
}
 
void loop() { // Now that all is set up, let's begin with the tasks

    delay(10000);
    // Let the library get the Temperature that DHT11 probe is measuring.
    float t = dht.readTemperature(); 
    if (isnan(t))
        t=-1; // if so, check the connection of your DHT11 sensor... something is disconnected ;-)
    float h = dht.readHumidity();
    if (isnan(h))
        h=-1; // if so, check the connection of your DHT11 sensor... something is disconnected ;-)
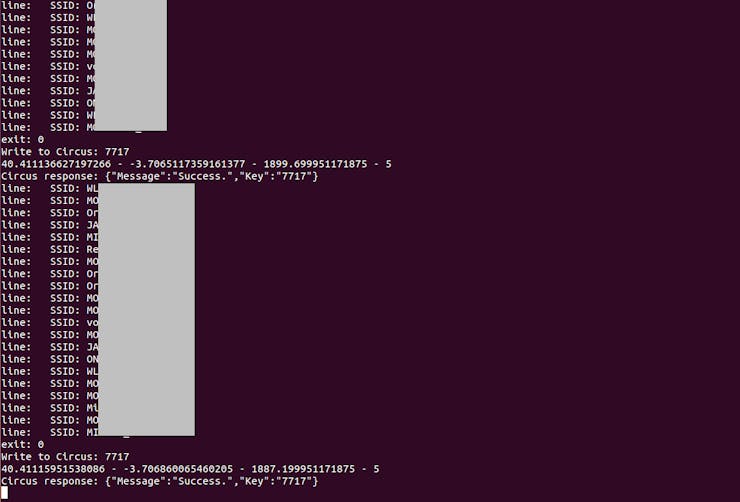
    // Show values, just for debuging
    Serial.println(""); Serial.print("Temperature: "); Serial.println(t); Serial.print("Humidity: "); Serial.println(h);

    // Report the values gathered by the sensor to the Circus
    circusESP32.write(temperature_key,t,token); // Report the temperature measured to Circus.
    circusESP32.write(humidity_key,h,token); // Report the humidity measured to Circus.
}

Simple, isn’t it? Will try to connect to Wifi and reach Circus platform via https. Later, in the loop, will measure the Temperature and Humidity and report (with ‘Write’ command) to Circus.

Don’t forget to:

  • Set your wifi SSID
  • Set your wifi password
  • Set the proper keys that you created at Circus
  • Set your personal token (find it at Circus in ‘account’ section, on the top-right corner clicking your image)
  • If you have another model of ESP32 or simply want to use another pin, check in the code the correct pin where you connected the DH11 output.
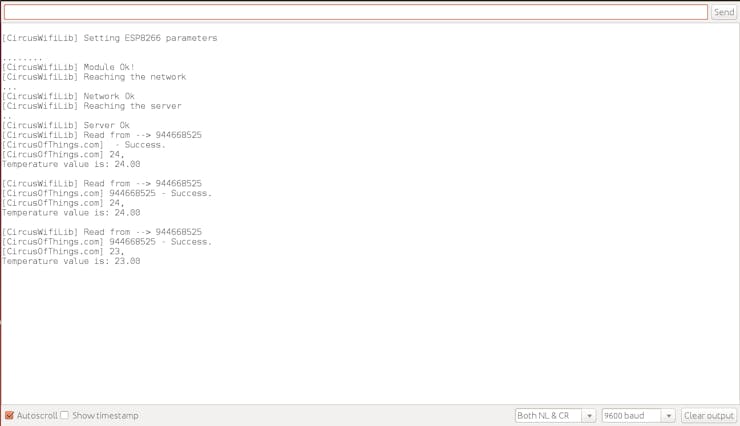
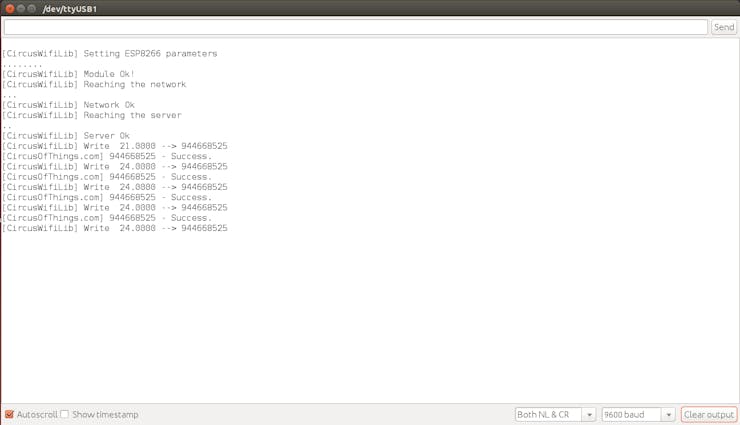
The result

Now watch the values dynamically change in the Workshop

Main value is changing

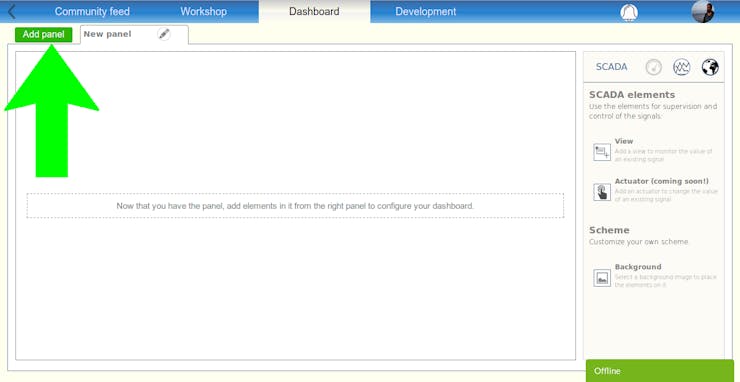
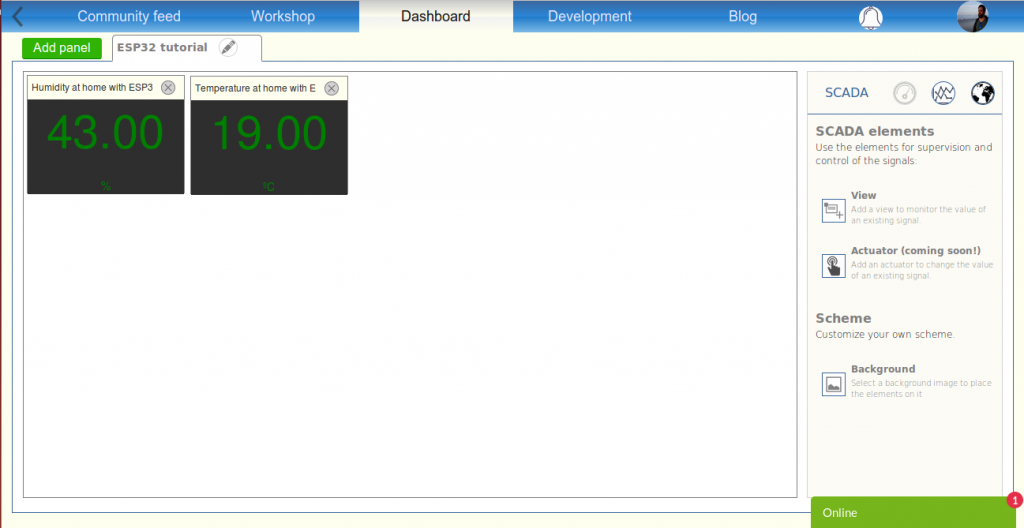
It’s time to set the dashboard to monitor your signals. Go to dashboard:

Go to dashboard

Add a new panel, and set a name for it, let’s say “ESP32 tutorial signals”

Add panel

Add a view for each signal that your ESP32 is feeding right now. Select them in the list after pressing “View”. Drag & drop it to place where you want in the screen

Add views
Your views in SCADA mode

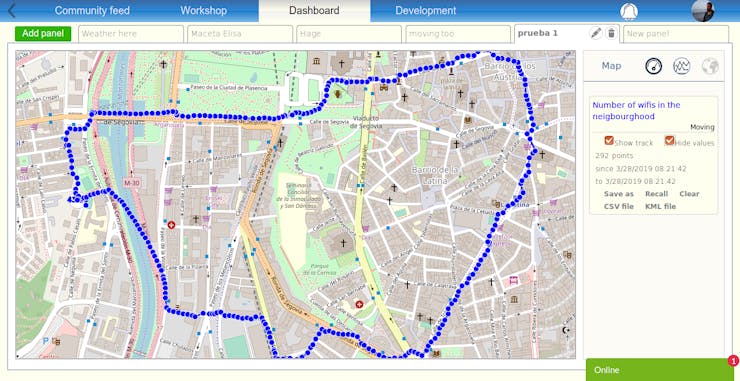
Switching the panel from “SCADA mode” to “Timeline mode”

… you will have both signals represented in graphical mode and in real-time

After a few hours. Humidity in blue, Temperature in green

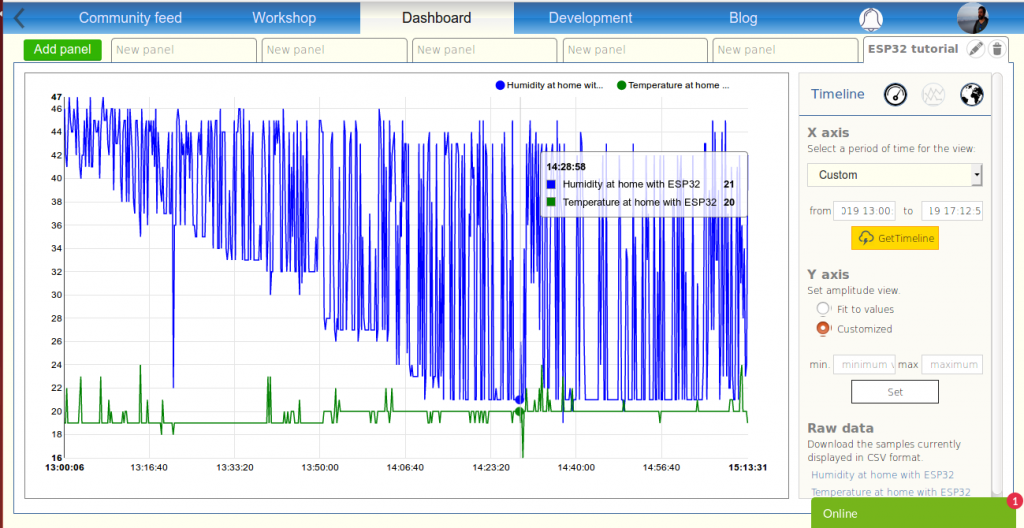
By pressing the links you can download the data in CSV format for each signal

There are many features more to explore!

Thanks for your time and reading this post. Please feel free to contact in chat or comments, your feedback is much appreciated.

Basic Warwalking with a Raspberry

An straight an reliable way to gather field data, posting it in real time to the web and having the CSV or KML available to download.

Basic Warwalking with a Raspberry

Let’s make it easy yet powerful: To have a working case we will look how many wifi networks are detected in eachpoint ofa path using a Raspberry Pi and coding in JAVA.

The things you need

  • Raspberry: I am using Raspberry 3, but there is no reason why you could not use another model (I didn’t try yet), while it has a wlan interface to detect networks and to reach the web using the connection shared by your cell phone.
Raspberry Pi model 3
  • A cell phone: Any with data connection that can share a wifi… in other words: any.
  • USB external battery: Any that can power you Raspberry, like the ones used as extra external batteries for the cell phones. Used to move freely in the field. It should be 5-6V. Please note that with a supply of 1000mA I had some trouble for the Pi to recognize the USB connection, but with one of 4000mA (reasonably charged) it worked well.
Portable phone battery
  • A GPS receiver: I am using Globalsat BU-353S4. Is a bullet proof old friend and is not expensive at all. It communicates by USB at 4800bauds and provides NMEA frames containing the GPS information. I will provide a library, so you only have to carry about the coordinates and you don’t have to study NMEA frames, nevertheless if you want to dive in take a look to this handy resource. While it is USB and NMEA there is no reason you can not use another receiver (I didn’t try yet).
GPS receiver
  • A free account at circusofthings.com: What can I say about my beloved community where easily interconnect your inventions. But let’s focus on the fact that you will have a dashboard ready-to-use and you won’t have to worry about the server side. You only need to create a free account.

Creating a signal to handle information at server

Create a free account at Circus:

Landing at Circus

Once inside, go to the “Workshop” where you will create a signal to handle the data:

Sight of the Community feed

Create a signal:

A workshop with user's signals
Once signal is created

Just give it a name, the description you think will fit to your signal, add tags, set visibility whether you want to show it or not, set the parameters (Note: those are only static information for people that will watch the signal, not actual variables):

A signal ready to work :)

Now you have set the signal. It has only static information right now, but soon your hardware will be feeding the changing value and the changing location.

Take note of the “key” displayed under the signal title, it will identify your signal when communicating with server.

One more thing: Also take note of the “token”, it will identify you when accessing the server. Find it clicking on your image, in the top-right corner, then “account”.

Setting up the software in the Raspberry

The JAVA code

I made a simple executable JAVA program called CircusField. It goes through a loop doing this tasks:

  • Takes GPS latitude, longitude, altitude coordinates (in decimal degrees). I use a library I made called jaumemirallesisern-gps.jar to read NMEA data from a GPS receiver through USB port. The object GPSNMEAserial needs two parameters: serial baud rate and USB port descriptor. In my case where 4800 and “/dev/ttyUSB0”.
  • Executes a Linux command (sudo iw dev wlan0 scan) to get the number of SSIDs detected. If you don’t have this command in your system, just install it: sudo apt-get update and sudo apt-get install iw.
  • Reporting to Circus Of Things the latitude, longitude, altitude coordinates, and the value (for us is the number of SSID read above). It is made through the Write command defined in the REST API of the Circus. You don’t have to code the API commands in JAVA as you can take profit of the ready-to-use library called circusofthings.jar.

And looks like this:

package circusfield;
  
import com.circusofthings.api.ver110.CircusLib;
import com.jaumemirallesisern.hardware.GPSNMEAserial;
import org.json.JSONObject;
import java.io.BufferedReader;
import java.io.IOException;
import java.io.InputStreamReader;
  
public class CircusField {
  
   private static final String KEY = "your_key_signal_at_circus_here";
   private static final String TOKEN = "your_circus_token_here";
   private static final int FREC = 10000; // as set in signal's parameters
   private static GPSNMEAserial gpsnmea;
  
   private static void mountGPS() {
       try {
           gpsnmea = new GPSNMEAserial(4800,"/dev/ttyUSB0");
       } catch (Exception e) {
           System.out.println("Error reaching gpsnmeaserial");
       }
   }
  
   private static int runLinuxCommand(){
       String s;
       Process p;
       int counter = 0;
       try {
           p = Runtime.getRuntime().exec("sudo iw dev wlan0 scan ");
           BufferedReader br = new BufferedReader(
               new InputStreamReader(p.getInputStream()));
           while ((s = br.readLine()) != null) {
               if(s.contains("SSID")){
               System.out.println("line: " + s);
               counter++;}
           }
           p.waitFor();
           System.out.println ("exit: " + p.exitValue());
           p.destroy();
           return counter;
       } catch (IOException | InterruptedException e) {return counter;}
   }
   protected static void delay(int t) {
       try {   
           Thread.sleep(t);
       } catch(InterruptedException e) {
       }
   }
   public static void main(String[] args) {
       mountGPS();
       CircusLib commands = new CircusLib(TOKEN);
       double lat;
       double lon;
       double alt;
       int nsats;
       double value;
       for (;;) {
           try {
               gpsnmea.receiveUARTData();
           } catch(Exception e){System.out.println("Error reading serial");}
           delay(100);
           value = runLinuxCommand();
           lat = gpsnmea.getLat();
           lon = gpsnmea.getLon();
           alt = gpsnmea.getAlt();
           nsats = gpsnmea.getNsats();
           if (!(lat==0&&lon==0)) {
               System.out.println("Write to Circus: "+KEY);
               System.out.println(lat+" - "+lon+" - "+alt+" - "+nsats);
               JSONObject obj = commands.writeValue(KEY, value, lat, lon, alt);
               System.out.println("Circus response: "+obj.toString());
           }
           delay(FREC);
       }
   }
}

Remember to replace the “key” and “token” from Circus for the “KEY” and “TOKEN” values respectively in the code above.

It can be executed in command line with:

sudo java -cp .:/home/pi/dtest:/home/pi/javalibs/* circusfield.CircusField

Libraries needed to be placed in your libraries folder:

circusofthings.com.jar

jaumemirallesisern-gps.jar

org.json.jar

rxtx-2.1.7.jar

Executing on boot

I do like this because I want to be sure that in the field I just need to power on the raspberry for the data to be gathered.

Place the above execution command in /ect/rc.local

Connecting the GPS

Just plug the GPS receiver in the USB. No further configurations or set up are needed.

Share your cell connection

In your cell share your data connection as a Wifi access point. So you will define a SSID name and a password.

In your Raspberry, connect and check to this SSID normally. You can do it in your Raspbian desktop or via commands. There is plenty of documentation to do this in the net, so I won’t stop on this.

Check it all

If everything goes right the JAVA program CircusField (executed manually or on boot) should throw an output like this:

Execution of JAVA code

And in your Workshop at Circus you should see the same signal you defined but now with value and geolocation changing (it may take some seconds as it needs time to write, time to poll in the app… be patient).

Signal completed

When you are outside you can watch this screen (always selecting the option “request desktop page” in your cell as we don’t have a working responsive version) to see if the values are varying as they should. You can also monitor the track in real-time setting a panel-map as described in next points.

Pack it

I can’t believe I never though about a rigid folder to chase my developments. It’s easy, the excess of cables is tidied up and you can file your gadgets in the shelf. An absolute win-win.

Ready to go

Going for a walk

Walk out the door, greet your neighbours ( a geek is never impolite 😐 ), enjoy the walk, come back…

Back at home

Now you gathered the data, you may want to set up a panel in your dashboard to monitor a handle the data. To do so, follow this simple steps:

Go to dashboard

Again in Circus

Create a panel

Dashboard

Choose add a view

New Panel

Select your signal

Adding view

Change to map mode

SCADA mode

Now that you successfully got the map to display your path, it’s time to recall the samples. Press recall and select the period of time when you went for the walk, and there you have it:

Track plot

Now you can:

  • Label this track for the next time have it easier to recall, pressing “save as”
  • Download it in KML or CSV
  • Share your track on map with other users
  • Among other features

If you want to see my walk, this is the signal. Once you add it to one of your panels recall it with the label I gave to it: “wifi-walk”.

Note: This will a particular case (counting SSIDs / Raspberry / JAVA), but you could use Circus for any value you can measure in the field, with whatever sensor you may think, with any hardware capable to reach the web, with any coding language…

Hope it helped and thanks for reading! Please, let us know your feedback.

Get Data from the Cloud to Your Arduino

Get an input for your Arduino from the cloud without taking care of server side.

Get Data from the Cloud to Your Arduino


Note

This tutorial is complementing the previously posted tutorial Publish Your Arduino Data to the Cloud. The idea this time is doing the opposite: getting data from cloud instead of posting it as before.

There are many things repeated from previous but I pretended to have a comprehensive thread to read, so this ‘redundant’ text will be in italic to be clear and skip if you want.

Overview

The object of this project is to show you how you can use data from a cloud platform and use it in your Arduino. That data might be posted by another Arduino, Raspberry, app…

We will make it as simple as it can be: We will read data from cloud, then show in serial monitor. The value won’t trigger any special thing locally, so the concept will be clear. In particular, let’s show the same temperature info we were posting in the tutorial before.

This is done without any web server on your Arduino but using an online service. In our project we are using an Arduino Nano model. There is no problem on using another board model -as Nano is the one with less resources- but you have to pay attention on which are the proper pins for your case.

To reach the web will use an ESP8266 WiFi module.

Finally, to get rid of the server side, we will use the online service circusofthings.com where we can link devices and apps with a single social account.

Powering the Components On

Please note this is a prototype tutorial and not a perfectly chased stand-alone product. What I mean is that I will use a laboratory stabilized voltage source to achieve 3.3V needed for the ESP8266 and I am not posting all necessary to get this voltage from a 5V, batteries, or grid… just to make it easier.

… but, if you decide to get those 3, 3V from another source, take into account:

  • ESP8266 is very delicate. Voltage above 3.6V will fry it. There are some discussions on the net about if it could stand for more voltage, but it depends on how the other pins are connected or which maker is it from. Don’t take risks, remember: less than 3.6V.
  • What nobody told me and maybe saves you one day is that you may see your module perfectly powered, with shinning leds… but recurrent problems to reach the network. It seems that a tinny below the nominal voltage may suppose a shortage on the power that can affect the RF performance.
  • Be aware that ESP8266 might consume up to 250mA. Don’t ever try to source it from your “3.3V” pin of your Nano, it isn’t able to source this current.

Again, for simplicity, I won’t use an external 5Vdc source to power the Nano board as it will connected to the PC with the USB port (as you will find on this tutorial, the serial communication on USB will be monitored for an interesting debug).

… but, if you decide to get those 5V from another source, take into account:

  • Let the Nano have, not only the 5V voltage, but the enough current. Your source should be able to supply 1A or more.
  • Connect the source on the “Vin” pin of the Nano, not in the “5V” pin. The first is the right place as it is protected by an internal regulator (don’t be afraid to give 6V). The second is an output that can feed other components.

Connecting the WiFi Module to the Board

Before we connect to board…

…do you really know which serial baud rate is set in your ESP8266 module by the maker or any other? If yes, skip to next point.

Makers usually set it to 9600 or 115200, but maybe another rate.

You may want to know it following a trial-and-error method when coding, just trying different baud rates and see if it works.

Or you may want to connect your PC to the ESP8266, interfaced in between by an FTDI module, to ask for the actual baud rate with ATcommands. I recommend this way as it is more illustrating and plus you can be sure your module is working properly (and not silently fried or corrupted). To achieve it I followed this tutorial, it’s really good and clear.

I recommend setting it at 9600bauds: easy and slow for your electronics, fast enough for your patience. The proper command will be AT+CIOBAUD=9600.

Connecting to the board

Now that we know which baud rate we have on our ESP8266 module we can go on.

We won’t use the RX/TX UART port of the Nano board to connect to the ESP8266. This is because we want to have this channel free for debugging from our PC.

Then we will use two different digital pins to have another serial port, what is called a “software serial port”. Let’s say D2 will be the TX and D3 will be the RX pin. Don’t worry on how to implement this new port, you will find in coding section how easy is to handle it with a library.

Then, this is how the connection between ESP8266 and Nano board should be.

Notice that the CHEN PIN on the ESP8266 has to be enabled by setting a high state (3.3V). A 10Kohm resistor is placed for protection.

Another concept to bear in mind is that de TX/RX is implented with different voltage levels in both devices. ESP8266 works between 0 and 3.3V, Nano does between 0 and 5V. As Nano is able to detect 3.3V as a high state, you can connect RX on Nano straight to TX on ESP8266. But for the opposite is recommended a tension divider to protect the RX input with a suitable 3.3V voltage when high

…. the thing is that me and many others have checked that it works fine during months without tension divider, ESP8266 seems protected enough. But don’t trust me on it, do it well.

Identifying the signal to read on the Service Online

Follow the process to sign up at circusofthings.com if you don’t have an account yet. It’s free and looking for testers.

In the community feed, look for the signal “Temperature at home” and remember its key so we can identify it (in our case, key: 944668525).

Coding and Uploading the Software

Before we set the code, you will have to get some Arduino libraries:

  • CircusWifiLib, to implement the API of the online community. Get it here.

(You don’t need any lib for Wifi/ESP8266 as it is done by CircusWifiLib).

Now we can take a look to the code:

/*
 ReadOneSignal.ino
 This example code that shows how to read a signal using the circusofthings.com API through its CircusWifiLib-2.0.0 library for Arduino.
 This code will temperature value beiing posted at at Circus.
 A software serial port is used, so the onboard serial port is used to monitor the process. You have 3 degrees for monitor: DEBUG_NO,DEBUG_YES and DEBUG_DEEP.
 There are no 3rd part libraries to use, beside SoftwareSerial.
 Created by Jaume Miralles Isern, November 13, 2018.
*/
#include <CircusWifiLib.h>
// ------------------------------------------------
// These are the CircusWifiLib related declarations
// ------------------------------------------------
int TXPinForWifiModule = 2;               // IO port in your arduino you will use as TX for serial communication with the wifi module
int RXPinForWifiModule = 3;               // IO port in your arduino you will use as RX for serial communication with the wifi module
char ssid[] = "your_SSID_here";           // your wifi network SSID
char pass[] = "your_WIFI_password_here";  // your wifi network password
int wifiSerialBaudRate = 9600;            // Baud rate between your arduino and your wifi module. Did you check that your module actually uses this baud rate?
int debugSerialBaudRate = 9600;           // Baud rate between your arduino and your computer
char token[] = "your_token_here";         // Your API token for Circus
char temperatureSignalKey[] = "your_signal_key_here";     // The key of the signal you that exists at circusofthings.com
SoftwareSerial ss(RXPinForWifiModule,TXPinForWifiModule);
CircusWifiLib circus(Serial,&ss,ssid,pass,DEBUG_YES,KEEP_ALIVE);
void setup() {
 Serial.begin(debugSerialBaudRate);
 ss.begin(wifiSerialBaudRate);
 circus.begin();    
}
void loop() {
 delay(5000);
 double d = circus.read(temperatureSignalKey,token);
 Serial.print("Temperature value is: ");
 Serial.println(d);
}

Put the SSID of your WIFI instead of your_wifi_SSID_here.

Put the WIFI password instead of your_wifi_password_here.

Put your account token instead of your_user_token_here.

Put the key of the signal you created instead of your_signal_key_here.

The code above will get the value posted at Circus every 5 seconds and will show it on the serial terminal.

Let’s put the sketch in the board as usual.

And open the serial monitor of the IDE (notice in our case we set 9600baud to debug).

Is displaying the temperature?

You did it! Now you have a way to get any data from the cloud as an input for your Arduino.

If you didn’t before, read how to do the oppossite: Publish Your Arduino Data to the Cloud.

Hope it was interesting for you. Thanks for your attention!

Publish Your Arduino Data to the Cloud

Publish your Arduino input in real-time so it can be accessible on the internet without taking care of server side.

Publish Your Arduino Data to the Cloud

Overview

The object of this project is to show you how to make accessible on the internet what is being read in one of your Arduino input pins.

This is done without any web server on your Arduino but using an online service.

In our project we are using an Arduino Nano model. There is no problem on using another board model -as Nano is the one with les resources- but you have to pay attention on which are the proper pins for your case.

To reach the web will use an ESP8266 WIFI module

What we will read is the temperature of the environment. To get the measures we have chosen a typical DHT11 sensor.

Finally, to get rid if the server side, we will use the online service circusofthings.com where we can link devices and apps with a single social account.

Powering the Components On

Please note this is a prototype tutorial and not a perfectly chased stand-alone product. What I mean is that I will use a laboratory stabilized voltage source to achieve 3.3V needed for the ESP8266 and I am not posting all necessary to get this voltage from a 5V, batteries, or grid… just to make it easier.

… but, if you decide to get those 3, 3V from another source, take into account:

  • ESP8266 is very delicate. Voltage above 3.6V will fry it. There are some discussions on the net about if it could stand for more voltage, but it depends on how the other pins are connected or which maker is it from. Don’t take risks, remember: less than 3.6V.
  • What nobody told me and maybe saves you one day is that you may see your module perfectly powered, with shinning leds… but recurrent problems to reach the network. It seems that a tinny below the nominal voltage may suppose a shortage on the power that can affect the RF performance.
  • Be aware that ESP8266 might consume up to 250mA. Don’t ever try to source it from your “3.3V” pin of your Nano, it isn’t able to source this current.

Again, for simplicity, I won’t use an external 5Vdc source to power the Nano board as it will connected to the PC with the USB port (as you will find on this tutorial, the serial communication on USB will be monitored for an interesting debug).

… but, if you decide to get those 5V from another source, take into account:

  • Let the Nano have, not only the 5V voltage, but the enough current. Your source should be able to supply 1A or more.
  • Connect the source on the “Vin” pin of the Nano, not in the “5V” pin. The first is the right place as it is protected by an internal regulator (don’t be afraid to give 6V). The second is an output that can feed other components (will be nice for our DHT11 sensor).

Connecting the WiFi Module to the Board

Before we connect to board…

…do you really know which serial baud rate is set in your ESP8266 module by the maker or any other? If yes, skip to next point.

Makers usually set it to 9600 or 115200, but maybe another rate.

You may want to know it following a trial-and-error method when coding, just trying different baud rates and see if it works.

Or you may want to connect your PC to the ESP8266, interfaced in between by an FTDI module, to ask for the actual baud rate with ATT commands. I recommend this way as it is more illustrating and plus you can be sure your module is working properly (and not silently fried or corrupted). To achieve it I followed this tutorial, it’s really good and clear.

I recommend setting it at 9600bauds: easy and slow for your electronics, fast enough for your patience. The proper command will be AT+CIOBAUD=9600.

Connecting to the board

Now that we know which baud rate we have on our ESP8266 module we can go on.

We won’t use the RX/TX UART port of the Nano board to connect to the ESP8266. This is because we want to have this channel free for debugging from our PC.

Then we will use two different digital pins to have another serial port, what is called a “software serial port”. Let’s day D2 will be the TX and D3 will be the RX pin. Don’t worry on how to implement this new port, you will find in coding section how easy is to handle it with a library.

Then, this is how the connection between ESP8266 and Nano board should be.

Notice that the CHEN PIN on the ESP8266 has to be enabled by setting a high state (3.3V). A 10Kohm resistor is placed for protection.

Another concept to bear in mind is that de TX/RX is implented with different voltage levels in both devices. ESP8266 works between 0 and 3.3V, Nano does between 0 and 5V. As Nano is able to detect 3.3V as a high state, you can connect RX on Nano straight to TX on ESP8266. But for the opposite is recommended a tension divider to protect the RX input with a suitable 3.3V voltage when high.

… the thing is that me and many others have checked that it works fine during months without tension divider, ESP8266 seems protected enough. But don’t trust me on it, do it well.

Setting the Temperature Sensor

What we see is it has only 3 pins. The “+” is where 5V will be provided, connecting it to the “5V” of the Nano board. The “-” is the common ground with the rest of components. And the “out” is not an analog or resistive output as one might guess, actually it’s a digital serial output as this sensor is provided with on board intelligent components.

Don’t worry about this protocol, as seen in next sections, we will easily find the Arduino library that lets you manage it with zero effort. It seems the specifications of this protocol are hard to find due to the lack information (only in chinese) just for the case you are interested in it.

We will read this serial communication on PIN 5 in our example (yes, it could be any other digital pin of your board while you bear it in mind when coding).

So, the connection is as simply as follows:

The Whole Gadget

All together should be connected like this:

Registering Your Pin on the Service Online

Follow the process to sign up at circusofthings.com if you don’t have an account yet. It’s free and looking for testers.

In your dashboard, create a “new signal”. Note that it displays a key that identifies your signal. Remember it for the next step.

Give it a name and feel free to edit its description, parameters, tags, and so for you and/or the community.

Coding and Uploading the Software

Before we set the code, you will have to get some Arduino libraries:

  • DHT Sensor Library, to communicate withe the sensor. Get it here.
  • CircusWifiLib, to implement the API of the online community. Get it here.

(You don’t need any lib for Wifi/ESP8266 as it is done by CircusWifiLib).

Now we can take a look to the code:

/*
 WriteOneSignal.ino
 This example code that shows how to feed a signal using the circusofthings.com API through its CircusWifiLib-2.0.0 library for Arduino.
 With this code you can feed a signal taking the values read from a temperature sensor. 
 In this case, we assume we have a DHT11 sensor that is controlled by a propietary protocol implemented in its specific library.
 A software serial port is used, so the onboard serial port is used to monitor the process. You have 3 degrees for monitor: DEBUG_NO,DEBUG_YES and DEBUG_DEEP.
 There are no 3rd part libraries to use, beside SoftwareSerial and DHT Sensor Library Built in by Adafruit Version 1.3.0 
 Created by Jaume Miralles Isern, October 26, 2018.
*/ 
#include <CircusWifiLib.h>
// ------------------------------------------------
// These are the CircusWifiLib related declarations
// ------------------------------------------------
int TXPinForWifiModule = 2;               // IO port in your arduino you will use as TX for serial communication with the wifi module
int RXPinForWifiModule = 3;               // IO port in your arduino you will use as RX for serial communication with the wifi module
char ssid[] = "your_ssid_here";             // your wifi network SSID
char pass[] = "your_wifi_password_here";             // your wifi network password
int wifiSerialBaudRate = 9600;            // Baud rate between your arduino and your wifi module. Did you check that your module actually uses this baud rate?
int debugSerialBaudRate = 9600;           // Baud rate between your arduino and your computer
char token[] = "your_token_here";    // Your API token for Circus
char analogSignalTemperatureKey[] = "944668525";    // The key of the signal you have created at circusofthings.com
SoftwareSerial ss(RXPinForWifiModule,TXPinForWifiModule);
CircusWifiLib circus(Serial,&ss,ssid,pass,DEBUG_YES,KEEP_ALIVE);
// ------------------------------------------------
// These are the Example related declarations
// ------------------------------------------------
#define DHTPIN 5      // digital for serial propietary portocol of sensor DHT11
#define DHTTYPE DHT11 // exact model of temperature sensor DHT 11 for the general library
DHT dht(DHTPIN, DHTTYPE);
void setup() {
 Serial.begin(debugSerialBaudRate);
 ss.begin(wifiSerialBaudRate);
 dht.begin();
 circus.begin();  
}
void loop() {
 float t = dht.readTemperature();
 if (isnan(t)) {
   t=-1; // if so, check the connection of your DHT11 sensor
 }
 delay(3000);
 circus.write(analogSignalTemperatureKey,t,token); 
}

Put the SSID of your WIFI instead of your_wifi_SSID_here.

Put the WIFI password instead of your_wifi_password_here.

Put your account token instead of your_user_token_here.

Put the key of the signal you created instead of your_signal_key_here.

The code above will get the value of the sensor every 3 seconds and will post it to the signal defined by key you own.

Let’s put the sketch in the board as usual.

And open the serial monitor of the IDE (notice in our case we set 9600baud to debug).

Is it reaching the web?

Do the Magic

If everything goes right you should see your signal in your dashboard showing the temperature you actually have in your room.

Now, edit its visibility in your dashboard and set it to public.

Then you have the link to share it with those who don’t have an account at Circus

Now is accessible by any other device or app in the world.

Anyone who follows our next tutorial can get data from the cloud to your Arduino and read this signal from an Arduino board.

Hope it was interesting for you. Thanks for your attention!